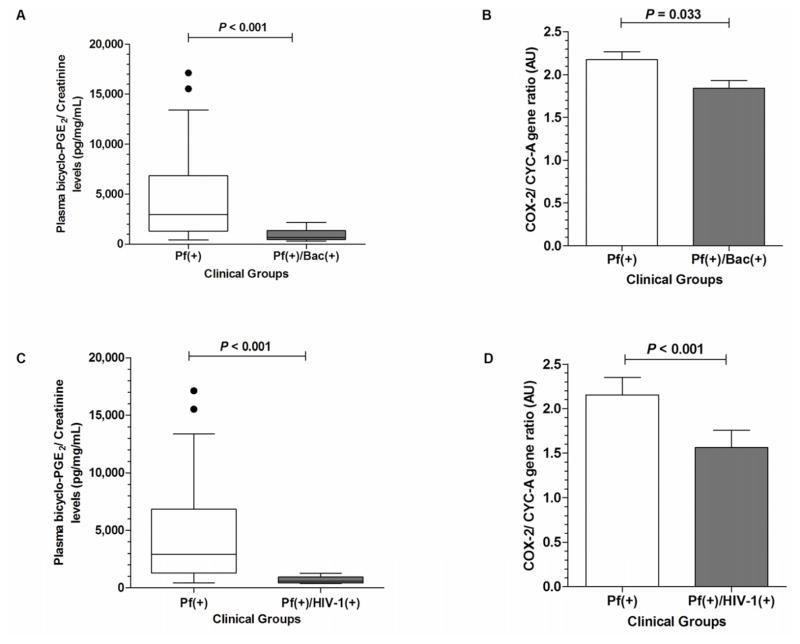
Figure 1. Systemic bicyclo-PGE2 and COX-2 mRNA expression in children with malaria and co-infected with either bacteremia or HIV-1.
(A) Plasma bicyclo-PGE2/creatinine ratio in children with malaria alone [Pf(+)] versus malaria and bacteremia [Pf(+)/Bac(+)]. (B) Semi-quantitative COX-2 gene expression expressed relative to CYC-A in arbitrary units (AU) in children with malaria alone [Pf(+)] versus those co-infected with bacteremia [Pf(+)/Bac(+)]. COX-2 mRNA expression is presented as means, with the error bars showing the standard error of mean (SEM). (C) Plasma bicyclo-PGE2/creatinine ratio among children with malaria alone [Pf(+)] versus those with malaria plus HIV-1 [Pf(+)/HIV-1(+)]. (D) Semi-quantitative COX-2 gene expression expressed relative to CYC-A (AU) in children with malaria alone [Pf(+)] versus those with malaria plus HIV-1 [Pf(+)/HIV-1(+)]. Plasma levels were compared using Mann-Whitney U test. Differences in COX-2 gene expression between groups were computed using Student’s t-test.

