
Fig 2. G', G'', and axial stress increase with fibrosis and with compression.
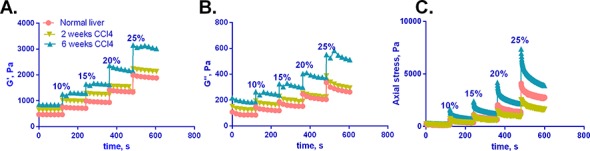
(A-C) Normal and fibrotic livers (2 and 6 weeks of CCl4 treatment) were subject to varying degrees of axial strain (compression, from 0–25%) as indicated. G' (A), G'' (B) and axial stress (C) were measured over 120 s after each incremental increase in compression. Curves shown are from single livers and are representative of results generated from 3–5 independent livers. (Mean curves +/- SD, representing results from all livers tested, are shown in S2 Fig).