
Fig 5. G’ increases linearly with compressional stress, while stress increases nonlinearly with compressional strain for normal and fibrotic liver.
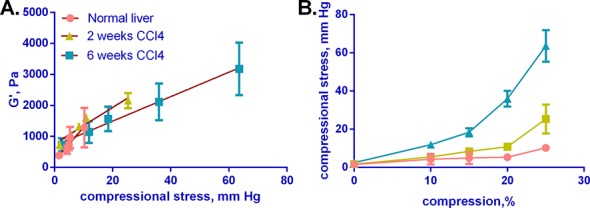
Normal and fibrotic (2 and 6 weeks of CCl4) livers were subjected to shear rheometry under various degrees of compression. Compressional stress was calculated in mm Hg and plotted against G' or compressional strain (% compression). (A) G' vs. compressional stress, showing a nearly linear relationship between the two conditions in both normal and fibrotic livers. Lines were fit to each curve (in red) and are shown in the graph. (B) Compressional stress vs. compressional strain, shown for normal and fibrotic livers. G’ and compressional stress values are after 120 s of relaxation. Curves reflect mean +/- SD for 3–5 livers per condition.