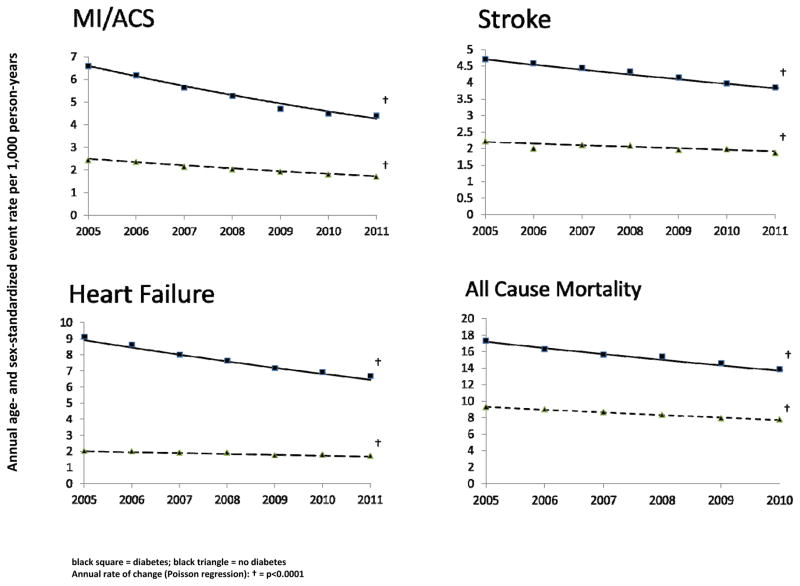
Figure 1. Rates of myocardial infarction/acute coronary syndrome, stroke, heart failure, and all-cause mortality from 2005 – 200 by diabetes among 2.5 million insured persons across 11 health care systems.
Black square = diabetes; black triangle = no diabetes
Annual rate of change (Poisson regression): † = p<0.0001

