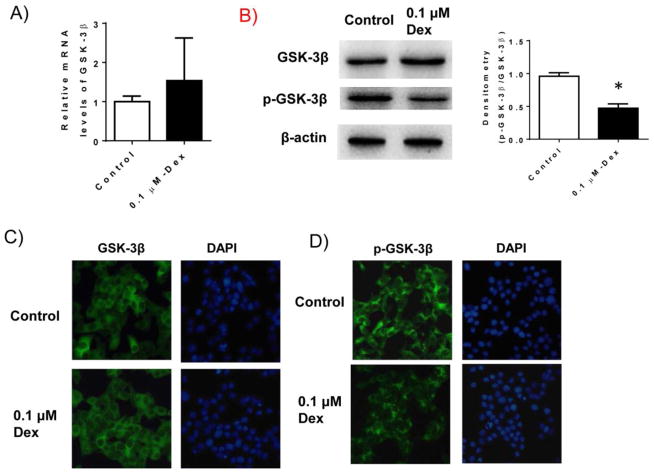
Figure 3. Dex treatment activated GSK-3β pathway.
INS-1 cells were cultured and treated with 0.1 μM Dex for 48 hours. After treatment, cells were harvested. A). mRNA levels of GSK-3β were determined by real-time PCR; B) The protein levels of total and phospho-GSK-3β in cell lysates were determined by western blotting. Beta-actin levels were used as loading control. Relative p-GSK-3β levels were determined by scanning densitometry of blots and normalized to total GSK-3β levles. Data are represented as mean ± SEM. * P<0.05 vs. control; C) Representative immunofluorescence staining of total GSK-3β in Dex treated INS-1 cells. DAPI staining showed the cell nuclei; and D) Representative immunofluorescence staining of phospho-GSK-3β in Dex treated INS-1 cells.

