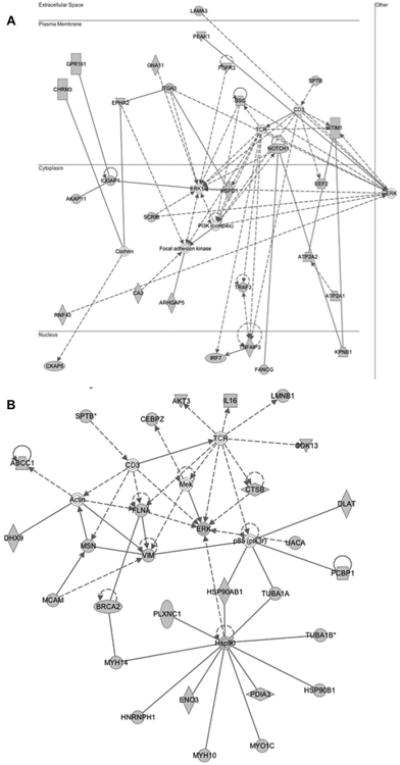
Figure 5.

Proteins differentially expressed were overlaid onto a global molecular network developed from information contained in the IKB. Genes or gene products are represented as nodes, and the biological relationship between two nodes is represented as an edge (line). Solid lines indicate a direct relationship and dashed lines indicate an indirect relationship between nodes. The gray nodes represent the proteins differentially expressed by greater than 1.5-fold identified using proteomics profiling. White nodes represent the IKB molecules associated with focus genes. Networks reflect (A) interaction network for proteins upregulated with BLM treatment (function: cellular movement, dermatological diseases, and disorder; p-value = 10−36) (B) interaction network for proteins downregulated with VEGF inhibitor treatment (function: cancer, organismal injury, and abnormalities; p-value = 10−35).
