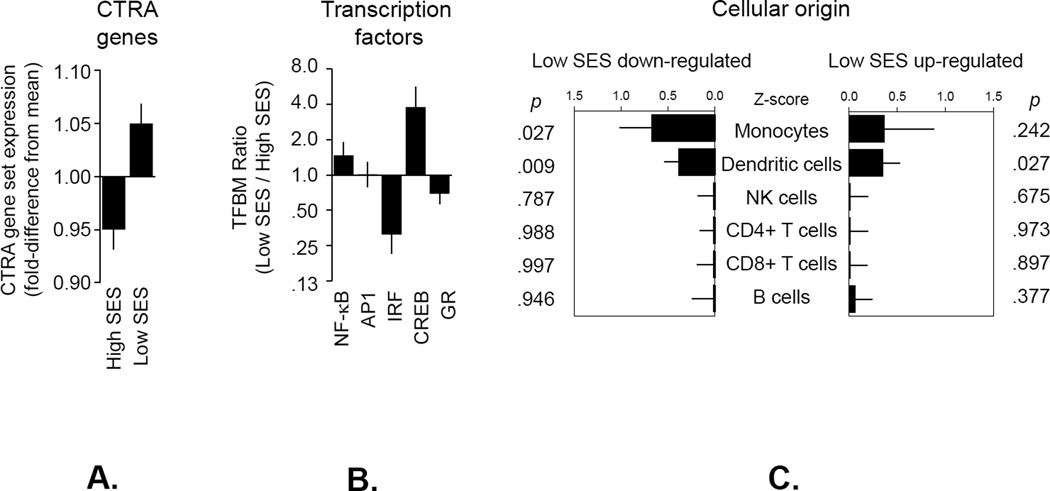
Figure 1.
Expression of the CTRA gene set, transcription control pathways and cellular origin. (A) Linear model-based estimates of fold-difference from the mean in expression in a 53-gene CTRA contrast score in PBMCs from individuals with low vs. high SES (adjusting for age, gender, race, BMI, number of comorbid conditions at time of transplant, and mRNA markers of major leukocyte subsets). Genes showing ≥ 20% difference in expression between HCT recipients of low vs. high SES were tested for (B) differential activity of specific transcription factors as indicated by TELiS analysis of transcription factor-binding motifs (TFBM) in proximal promoter sequences of up- vs. down-regulated genes (35) and (C) PBMC cell type of origin as indicated by TOA cell-type diagnosticity z-scores (32). Error bars indicate standard error.

