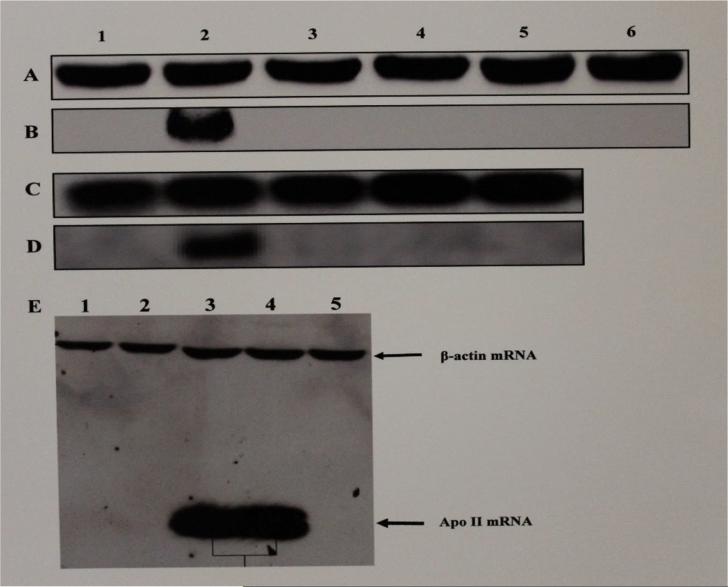
Fig. 4. Northern Blot Analysis for Transcription of Apolipoprotein II mRNA in Livers of Roosters Treated With Estrogen, Test SERMs or Combinations of Estrogen and Test SERMs.
The figure shows a chemiluminograph of a Northern blot of liver cytosolic extracts from roosters who received treatment with the vehicle (lane 1, panels A, B, C & D), estrogen (lane 2, panels A, B, C & D), resveratrol (lane 3, panels A & B), genistein (lane 4, panels A & B), catechin (lane 5, panels A & B), tamoxifen (lane 6, panels A & B), pterostilbene (lane 3, panels C & D), raloxifene (lane 4, panels C & D), clomiphene (lane 5, panels C & D). Panels A and C were probed with biotinylated antisense chicken β-actin DNA oligonucleotide probe and panels B and D were probed with biotinylated antisense chicken apo II DNA oligonucleotide probe. Panel E shows the antiestrogenic effect of the SERMs on apo II gene expression and the relative electrophoretic mobility of apo II mRNA in relation to the β-actin mRNA. Lanes 1-5 in panel E correspond to whole cell RNA from livers of roosters treated with estrogen + resveratrol (lane 1), estrogen + genistein (lane 2), estrogen (lanes 3 & 4), and estrogen + catechin (Lane 5), probed with biotinylated apo II and β-actin antisense DNA oligonucleotides.

