
Figure 4.
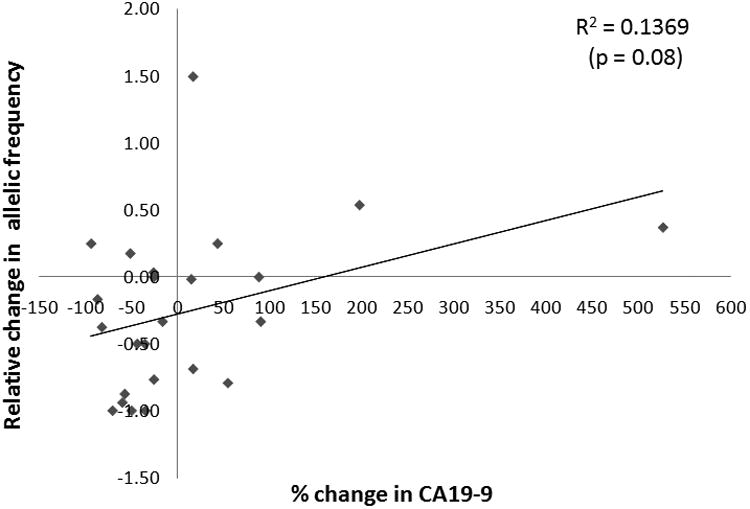
Scatter plot showing correlation between CA19-9 changes (x-axis) and relative changes in frequency of the most frequent mutant allele in cfDNA as determined by the Guradant360 assay (y-axis). Spearman's Rho was calculated to assess for correlation.