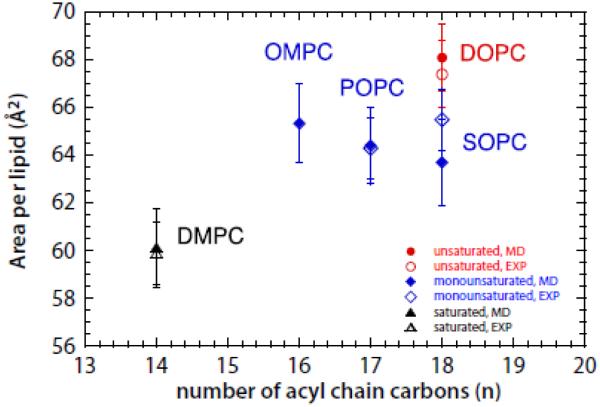
Figure 1.
Area per lipid plotted as a function of the average number n of the acyl carbons and displayed with symbols colored according to the degree of unsaturation of the lipid. The fully saturated lipid (DMPC) is represented with black triangle, the lipids with one mono-unsaturated chain and one saturated chain (OMPC, POPC and SOPC) with blue diamonds, and the lipid with two mono-unsaturated chains (DOPC) with red circles. Simulation data are represented with filled symbols, experimental data with empty symbols. The error bars are the standard deviation from the mean values.

