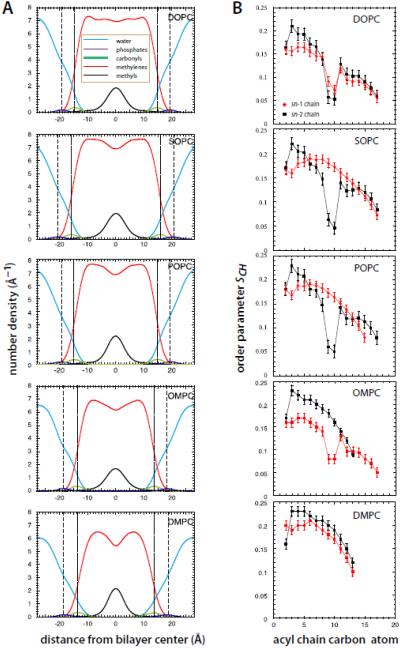
Figure 2.
Structures and order parameter profiles of the five lipid systems studied. A. Transbilayer distributions of the lipid component groups (see legend) for the lipid bilayers simulated in this study. Dashed lines indicate the mean position of the phosphate groups and the dotted lines the mean position of the carbonyl groups. Note that the positions of the carbonyl groups approximate the locations of the water/hydrocarbon interface, marked with arrows in Figs. 3 and 4. Areas under of purple, green, and black curves equal the number of component groups: 1 PO4, 2 COO, 4 CH3. Areas under red curves equal the number of non-methyl acyl chain carbons. Areas under blue curves equal the number (30) of waters/lipid. The positions of the atoms were computed at 10 ps intervals and averaged. For the phosphates and carbonyls, the distributions were fit with Gaussian functions. B. Order parameter profiles for the sn-1 (red) and sn-2 (black) acyl chains for DOPC, SOPC, POPC, OMPC, and DMPC lipid bilayers. See Methods. Order parameters were calculated at 10 ps intervals for the last 60 ns of the simulations and averaged. The error bars are the computed standard errors of the mean.

