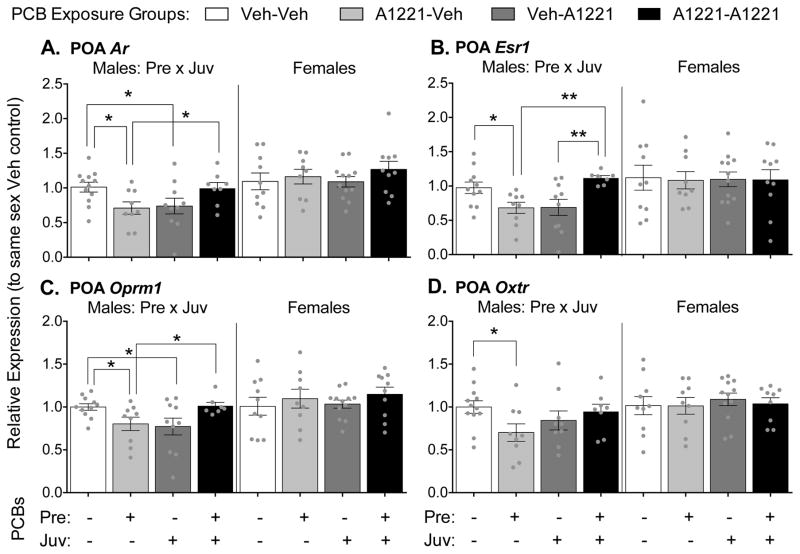
Figure 3.
Gene expression levels in the preoptic area (POA) are shown. Levels of Ar (A), Esr1 (B), Oprm1 (C) and Oxtr (D) are shown as mean ± SEM, with dots indicating individual data points. Note different y-axis scales between graphs. Within-sex main effects (ME) of prenatal or juvenile exposure, or interactions (Pre x Juv) between the two, are described in each subtitle, with specific group differences indicated by * p < 0.05, ** p < 0.01.

