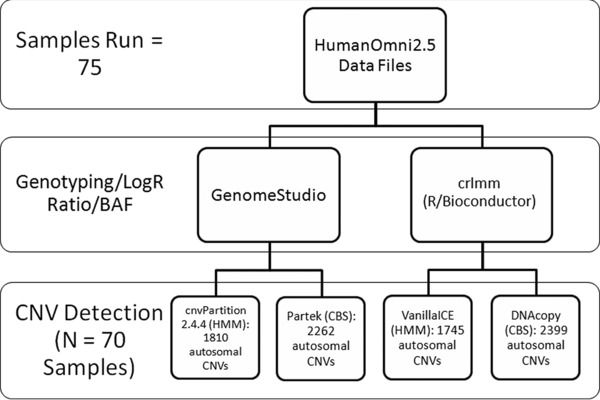
Figure 1.

Flow chart of data analysis steps. Raw data were imported into two independent genotyping and sample/reference ratio‐calculating programs. Output from each of these programs was analyzed by software implementing two different classes of CNV detection algorithms, hidden Markov model (HMM) and circular binary segmentation (CBS). These programs generated four lists of putative CNVs. A total of 645 CNV segments, identified in at least three of the four lists, were further examined.
