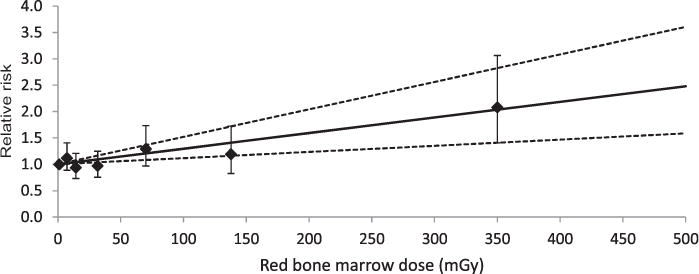
Figure 1.

Relative risk of leukaemia, except chronic lymphocytic leukaemia, associated with dose to red bone marrow among nuclear workers. Nuclear Workers in France, the UK and the USA, 1943–2005 (Leuraud et al., in revision). The solid line is the fitted linear dose-response model (excess relative risk per Gy=2.96) and the dotted lines are the likelihood-based, linear fitted 90% CI. Bars represent 90% CI for relative risks. The diamonds represent the estimated relative risk at the level of exposure on the x-axis.
