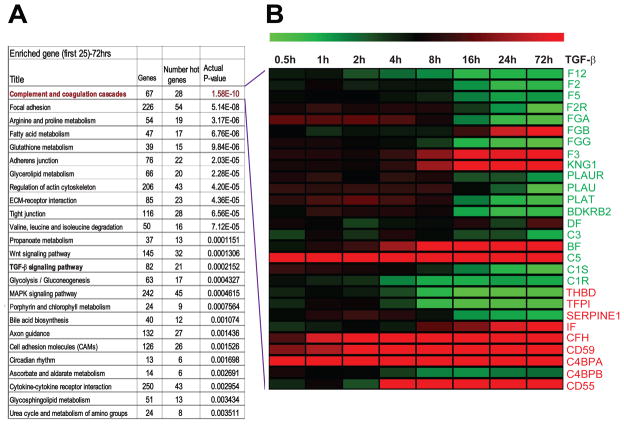
Figure 1. List of top 25 biological pathways enriched and heat map of complement pathway genes differentially expressed during TGF-β-induced EMT.
Pathway enrichment analysis was performed by Metacore algorithm (GeneGo.com) and Top 25 pathways we most significant p-values are listed (A). Heat map (green: down regulation, red: up regulation) representing time course of 28 differential expressed complement pathway genes during TGF-β-induced EMT. Gene names in green and red are positive and negative regulators of complement pathway respectively (B).

