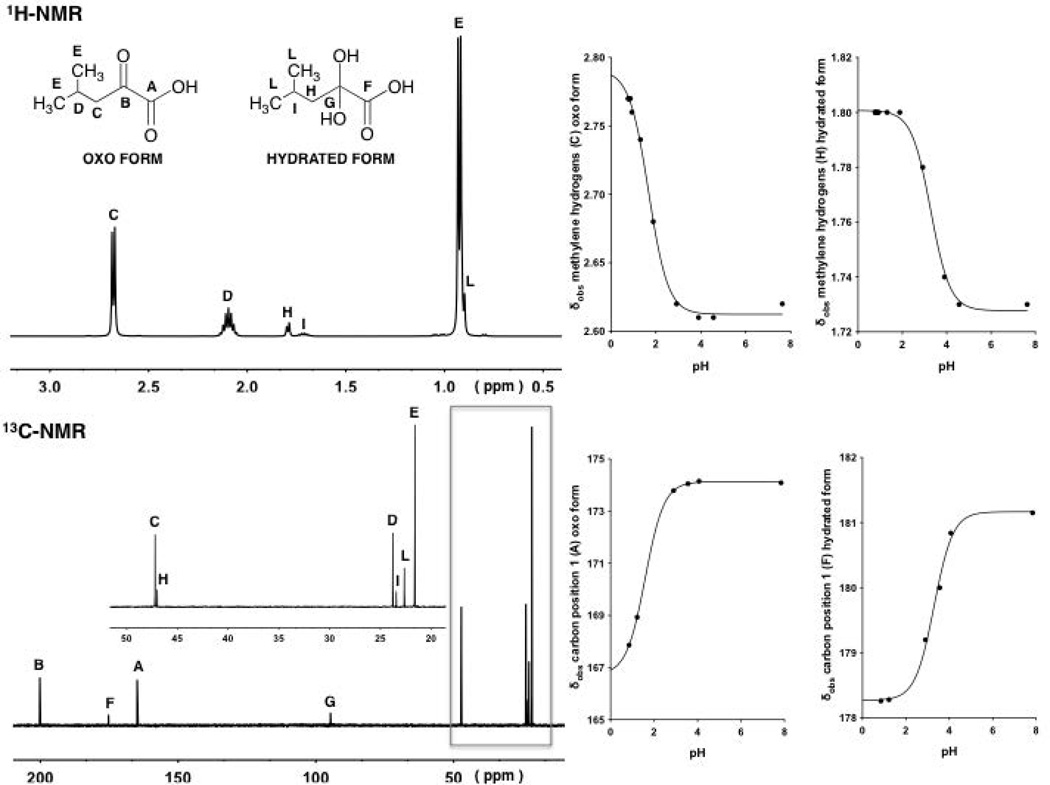
Figure 4.
1H-NMR and 13C-NMR of compound 3 at pH values at approximately 1.8 and 0.8, respectively (left). Observed chemical shifts (δobs) of the signals arising from the methylenehydrogens and the carbon in position 1 associated with the oxo and hydrated forms of 3 plotted against pH (right).The four continuous lines with a sigmoidal shape are described by Eq.14, fitting δobs values at different pH values.

