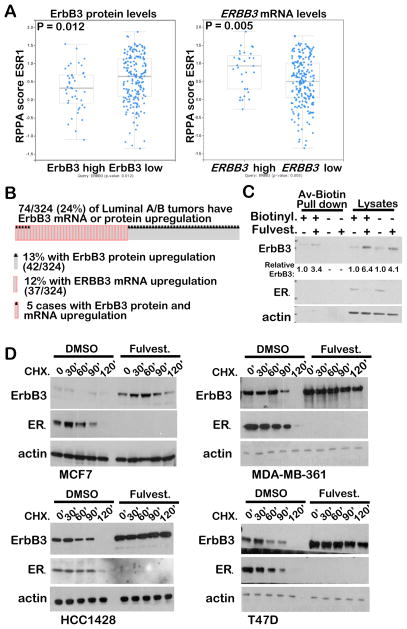
Figure 2. ErbB3 protein levels correlate inversely with ERα, but ERBB3 mRNA levels do not.
A. Using TCGA-curated luminal breast cancer datasets, the RPPA protein score for ESR1 (ERα) was plotted for those tumors with high ErbB3 protein expression or high ERBB3 mRNA expression as compared to the remaining luminal tumors. Midlines represent average, whiskers indicate S.D. Analysis was performed on cBioPortal.org.
B. Oncoprint generated using cBioportal software (www.cbioportal.org) to analyze TCGA-curated Luminal A/B tumors for tumors with high ErbB3 RPPA scores or high ERBB3 mRNA expression. Unaltered cases were removed to demonstrate the distinct compartments where ErbB3 mRNA and protein up-regulation fail to overlap.
C. Western analysis of whole cell lysates or avidin-biotin pull-downs from biotin-labelled MCF7 cells (lanes 1–2 and 5–6). Cells without biotin labeling were used as negative controls for avidin-biotin pull downs.
D. Western analysis of whole cell lysates harvested from cells cultured in 10% serum for 24 h with DMSO or fulvestrant (1 μM), and for the final 0–120 minutes of culture with cycloheximide (CHX),

