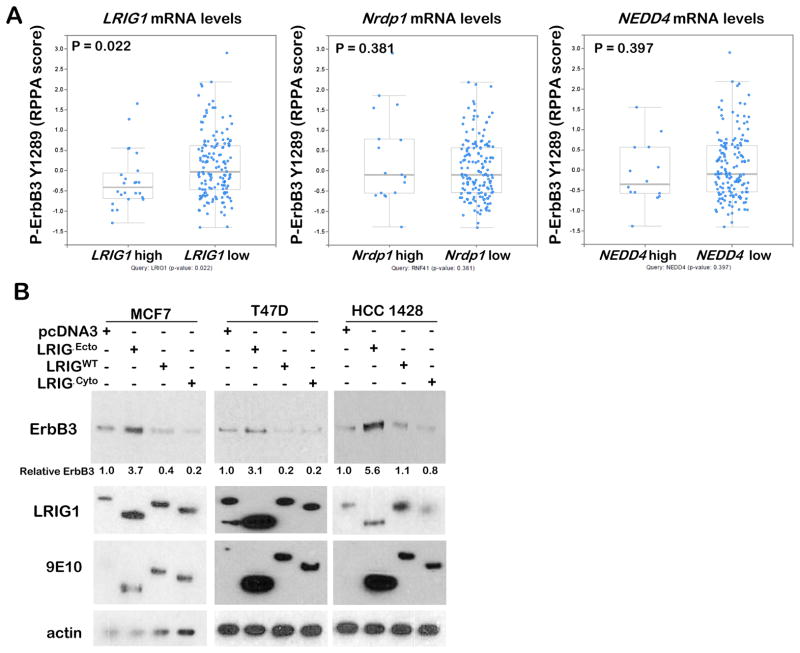
Figure 3. LRIG1 decreases expression of ErbB3.
A. Using TCGA-curated luminal breast cancer datasets, the RPPA protein score for ErbB3 phospho-Tyr1289 was plotted for those tumors with high LRIG1, NRDP1, and NEDD4 mRNA expression as compared to the remaining luminal tumors. Midlines represent average, whiskers indicate S.D. Analysis was performed on cBioPortal.org.
B. Western analysis of whole cell lysates harvested from cells stably expressing the empty pcDNA3.1 vector, LRIG1ΔEcto (a dominant negative LRIG1 mutant), LRIG1-WT, and LRIG1ΔCyto (an active LRIG1 mutant).

