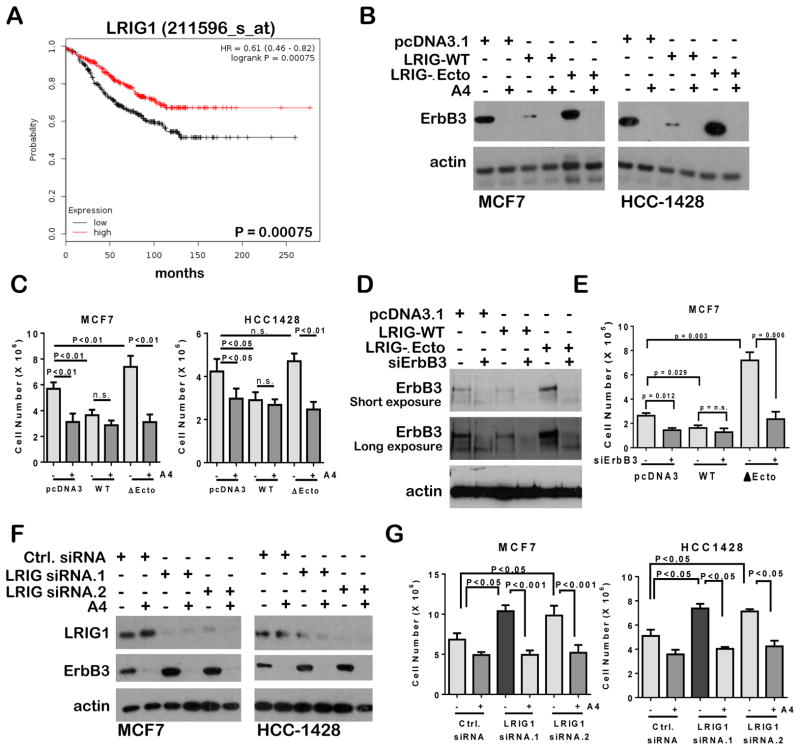
Figure 4. ErbB3 up-regulation drives increased growth of cells lacking LRIG1 activity.
A. Transcript levels of LRIG1 were assessed in tamoxifen-treated breast cancer expression microarray datasets and used to generate a Kaplan-Meier survival curve using KmPlot.com. Analysis included all tumors treated with or without chemotherapy, and excluded all samples not treated with tamoxifen. The probes used for analysis are indicated at top of panel.
B. Western analysis of whole cell lysates harvested form cells stably expressing pcDNA3.1, LRIG-WT, or LRIG1-ΔEcto, and cultured 24 hours in 10% serum with antibody A4 (2 μg/ml) or IgG.
C. Cells cultured for 3 days in 10% serum in the presence or absence of antibody A4 (2 μg/ml) were collected by trypsinization and counted. Average cell number (± S.D.) is shown. N = 3, each counted in duplicate. Student’s T-test.
D. Western analysis of whole cell lysates harvested form cells transiently transfected with ErbB3 siRNA sequences or with non-targeting siRNA sequences. 24 h after transfection cells were seeded, and cultured 72 hours in 10% serum prior to collection for western analysis.
E. 24 hours after transient transfection with ErbB3 siRNA sequences or with non-targeting siRNA sequences, equal number of cells were seeded and cultured in 10% serum for 3 d. Cells were collected by trypsinization and counted. Average cell number (± S.D.) is shown. N = 5, each counted in duplicate. Student’s T-test.
F. Western analysis of whole cell lysates harvested from cells transiently transfected with LRIG1 siRNA sequences or non-targeting siRNA sequences. 72 hours after transfection, cells were cultured in 10% serum with antibody A4 (2 μg/ml) or IgG for 24 h.
G. 24 hours after transient transfection with LRIG1 siRNA sequences or with non-targeting siRNA sequences, cells were cultured in 10% serum with antibody A4 (2 μg/ml) or IgG for 3 d. Cells were collected by trypsinization and counted. Average cell number (± S.D.) is shown. N = 5, each counted in duplicate. Student’s T-test.

