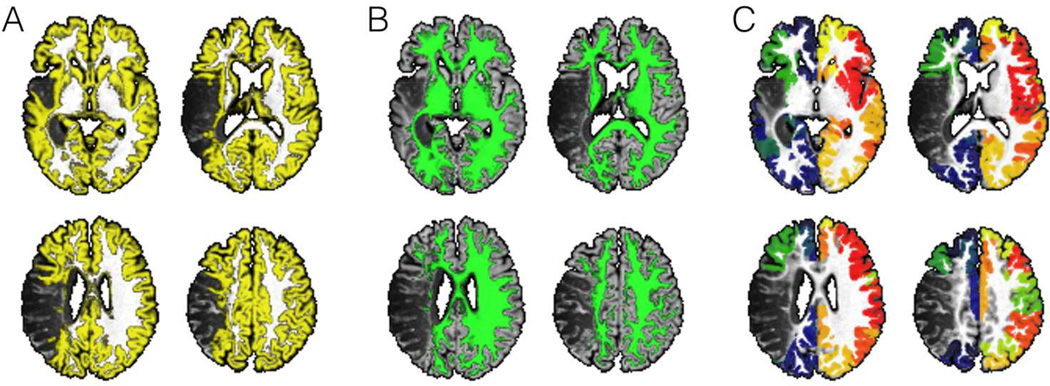
Figure 1.
This figure summarizes the initial preprocessing steps employed to evaluate structural connectivity. Images from one representative subject are shown. The T1 weighted images are segmented into probabilistic maps of gray matter (panel A) and white matter (panel B). The probabilistic map of gray matter is then divided into anatomical regions of interest (ROIs) corresponding to Brodmann Areas (BA) (panel C – each color representing a different ROI);.

