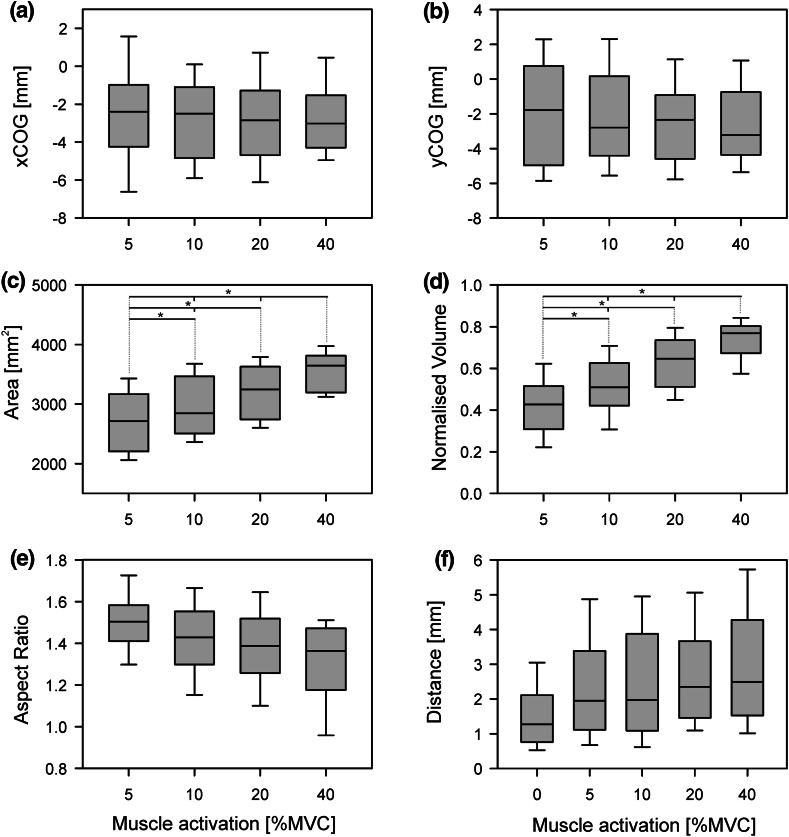
Fig. 5.
Group data for the effect of muscle activation on TMS maps (n = 11). Four levels of muscle activation, 5, 10, 20 and 40 % of maximum voluntary contraction (MVC), were compared. All statistical testing was performed using the non-parametric Friedman Test and any significant difference were further explored using the Wilcoxon Signed-Rank Test. Statistical significance between pairs was declared when P < 0.0083 (Bonferroni adjusted) and is indicated by *. a, b Group data for both x- and y-coordinate of the centre of gravity. No effect was found for muscle activation. c, d Group data for the effect muscle activation on map area and map volume. A significant effect of muscle activation was found on both map area and map volume. All pairs were found to be significantly different for both the map area and map volume. e The maps aspect ratios for different levels of muscle activation. No effect for muscle activation on aspect ratio was found. f Group data of the Euclidian distance of each level of muscle activity versus the resting condition

