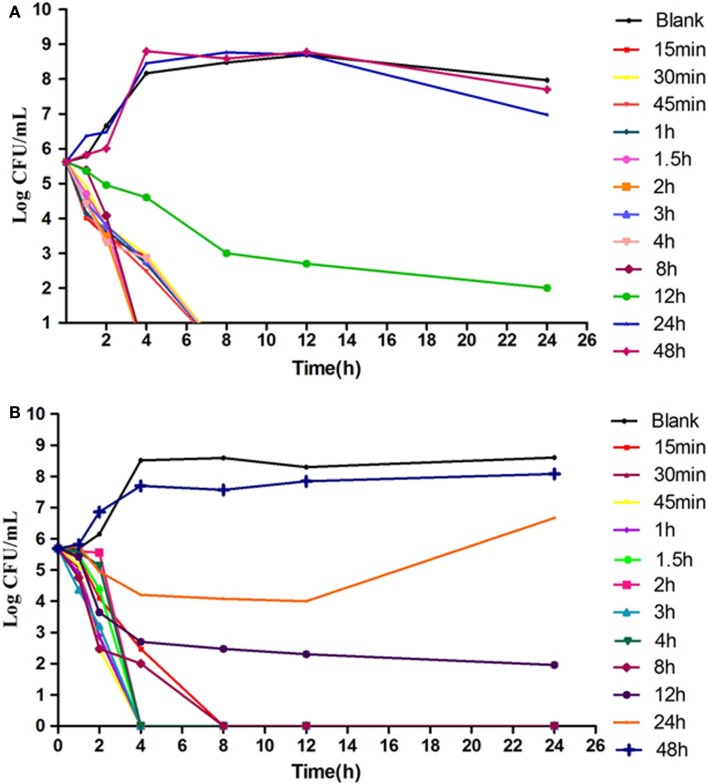
Figure 5.
TheEx vivo inhibition curve in the intestinal content from healthy chicken (A) and infected chicken (B). The X-axis was the time point during the 24-hours incubation and Y-axis was the bacterial number under exposure to intestinal samples collected from different time point in the PK study.

