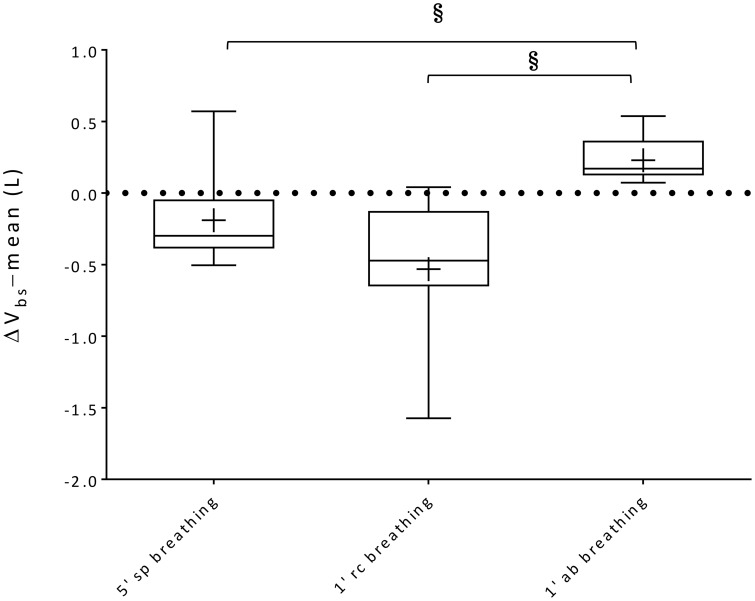
Figure 7.
Box-and-whisker plots illustrating ΔVbs-mean during 5′ spontaneous breathing, 1′ rib cage breathing and 1′ abdominal breathing mode exercise respectively. Central line, box and whisker limits represent median, interquartile range and minimum and maximum values of the data, respectively. + represents the mean value; §p < 0.05 vs. abdominal breathing mode.

