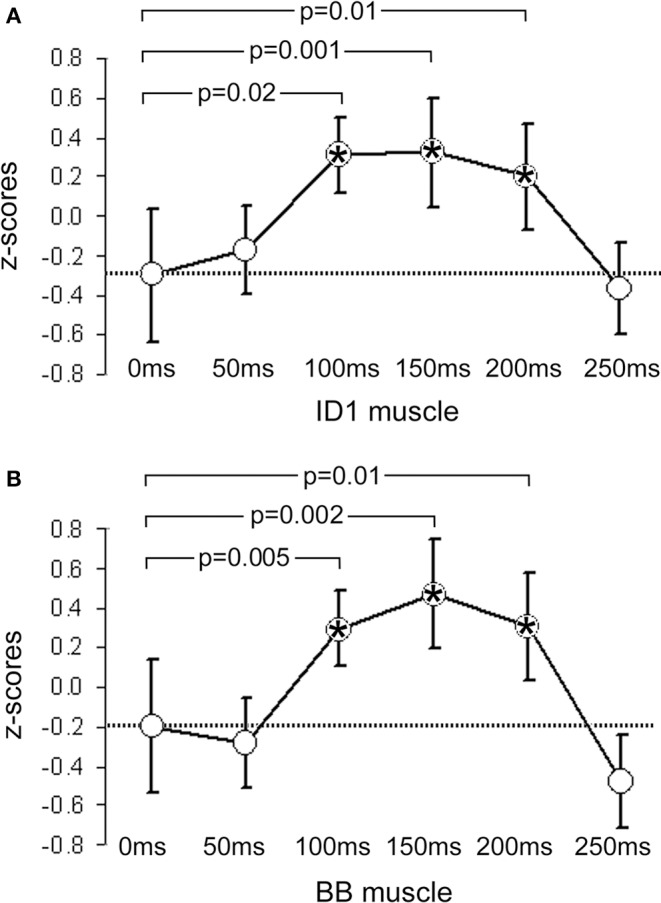
Figure 1.

Mean z-scores pooled from all participants and across all cry types. (A) shows data from the ID1 muscle and (B) data from the BB muscle. Bars indicate 95% CIs. The dashed line represents the mean value obtained at 0 ms (baseline). P-values indicate significant differences between the data obtained at 0 ms and the data obtained at the other 5 ISIs. Significant time-points are indicated with asterisks.
