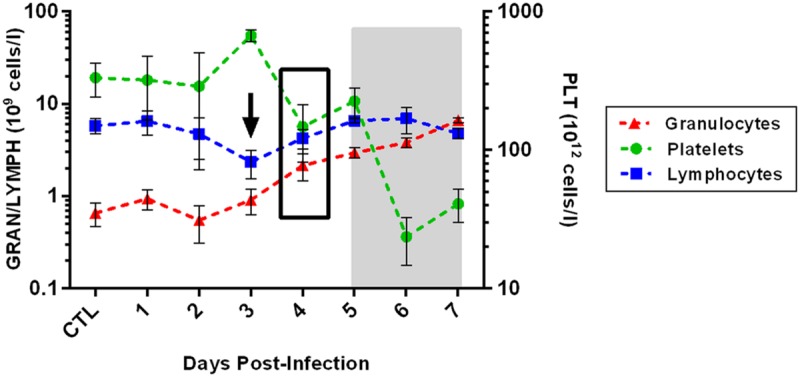
FIGURE 6.

Changes in blood cells over the course of infection. The arrow represents a significant decrease in blood lymphocytes at that time point, as measured by t-test. The black box represents the time point at which both granulocytes and platelets differ significantly from controls (as measured by ANOVA with multiple comparison test), and these differences persist through the end of infection. The gray shaded box represents the window of clinical disease (5–7 dpi).
