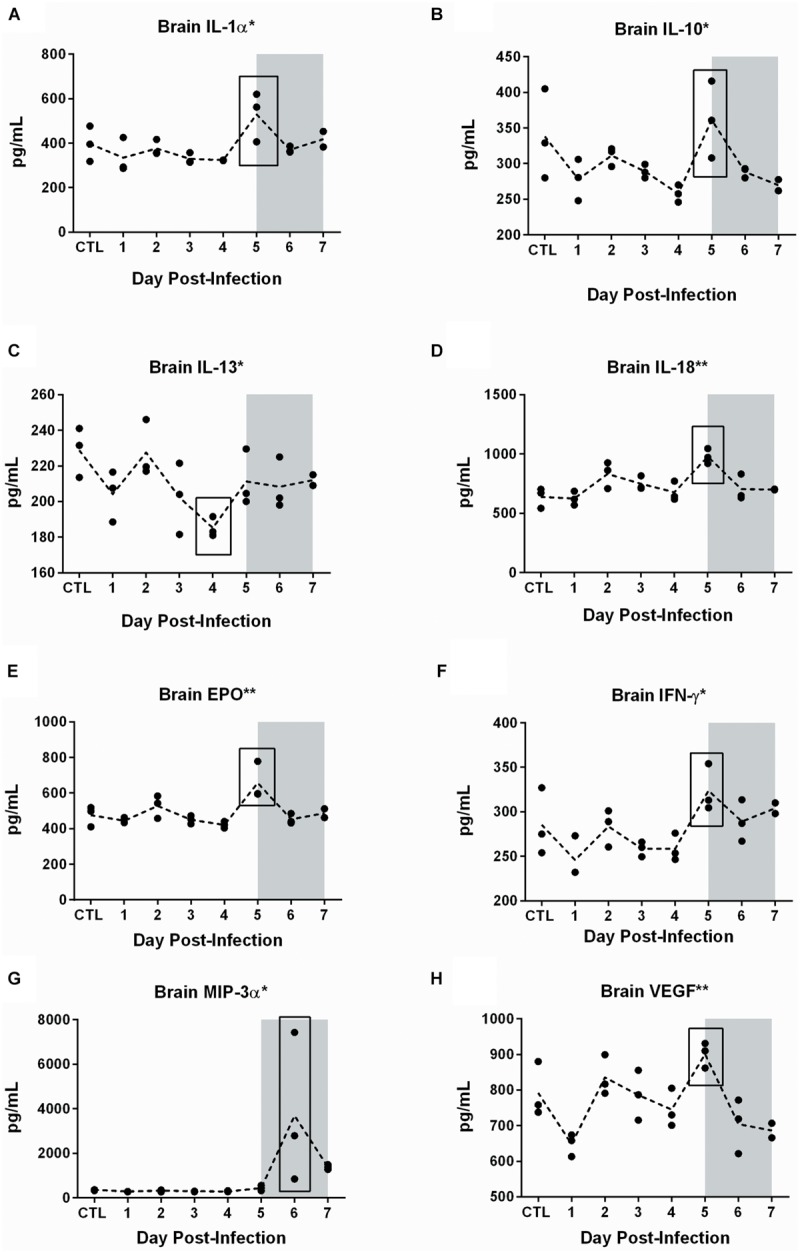
FIGURE 9.

Cytokine and chemokine dysregulation in the brain of RVFV-infected Lewis rats. The eight cytokines shown in this figure were statistically significant in brain but not serum. The level of significance by ANOVA is reflected by the number of asterisks on each graph title, where ∗p ≤ 0.05, ∗∗p ≤ 0.01, ∗∗∗p ≤ 0.001, ∗∗∗∗p ≤ 0.0001. Individual time points were compared to uninfected controls by t-test. Significant time points are indicated by the black box. The gray shaded box on all graphs represents the window of clinical disease (5–7 dpi).
