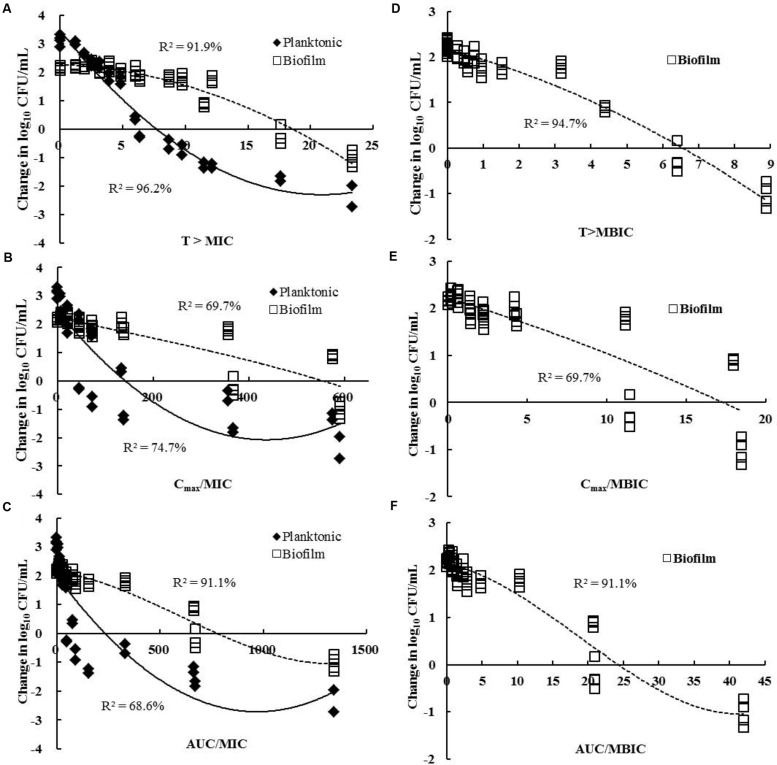
FIGURE 3.
Relationships between the change in log10 number of CFU for MRSA-M4 and PK/PD parameters of cefquinome. Each symbol represents the data from each catheter segment or tissue fluid. (A) T > MIC; (B) Cmax/MIC; (C) AUC24h/MIC; (D) T > MBIC; (E) Cmax/MBIC; (F) AUC24h/MBIC. The R2 value is the determination coefficient. Data points below the horizontal line represent killing and points above the horizontal line represent growth. Planktonic cells, filled diamonds; biofilms, and open squares.

