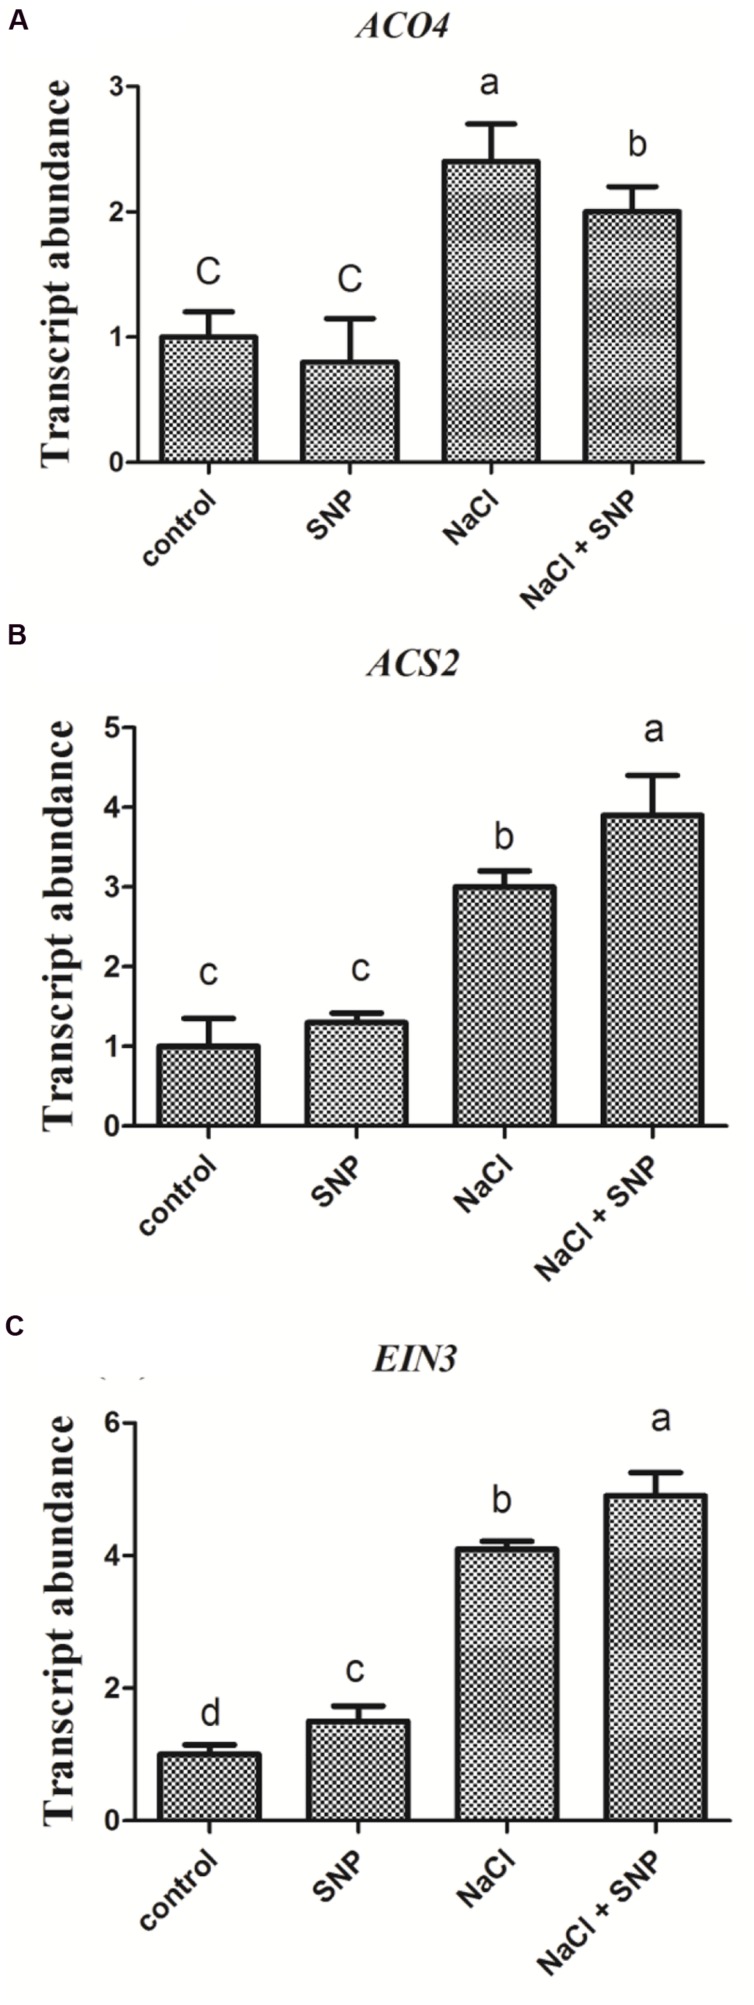
FIGURE 5.
Transcriptional comparison of ACO4, ACS2, and EIN3 in Col-0 seedlings affected by high salt and NO donor. 5-day-old seedlings were exposed to four treatments 0 mM NaCl, 50 μM SNP, 200 mM NaCl, and 200 mM NaCl plus 50 μM SNP for 6 h. Then the seedlings were subjected to qRT-PCR analysis to compare the transcriptional abundance of ACO4 (A), ACS2 (B), and EIN3 (C). Data are mean values (SE) of three independent experiments. Within each set of experiments, bars with different letters were significantly different at the 0.05 level (Duncan’s test).

