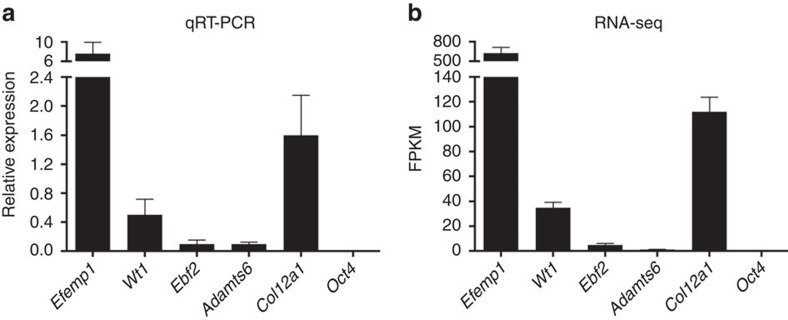
Figure 2. Expression analysis of Efemp1, Wt1, Ebf2 and Adamts6 by qRT-PCR (a) and RNA-seq (b).
Efemp1 is expressed at a high level, Wt1 at a moderate level and Ebf2 and Adamts6 at low levels in mouse connective tissue compared to a connective tissue expressed gene Col12a1 (positive control) and Oct4 that is not expressed in this tissue (negative control). Data are represented as mean±s.d. for the qRT-PCR and ±s.e.m. for the RNA-seq (n=12). For qRT-PCR three samples were analysed in three replicates of each reaction and relative expression levels calculated by the ΔCT method. For RNA-seq, three replicates were analysed and normalized gene expression values, FPKM, were obtained for each replicate using Cufflinks2.

