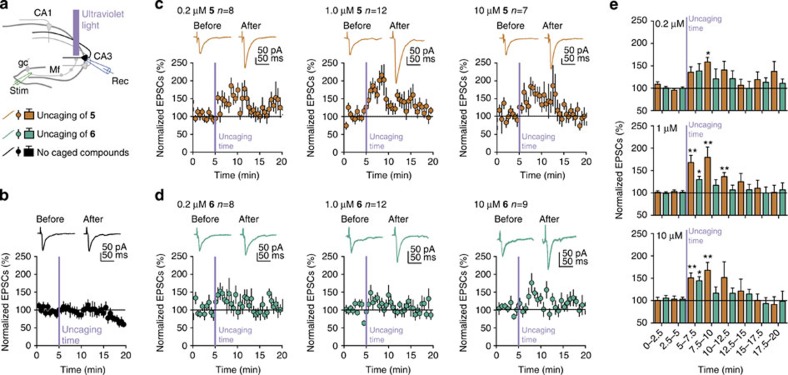
Figure 5. Potentiation of mossy fibre (Mf) synaptic transmission following photorelease of AA at the plasma membrane versus internal membranes.
(a) Schematic representation of a hippocampal slice with recording (blue, in a CA3 pyramidal cell) and stimulating electrodes (green, inside the dentate gyrus). Slices were perfused with compound 5 or 6 for 10–15 min before flashing ultraviolet light in the stratum lucidum near the recorded CA3 pyramidal cell. gc, granule cell; rec, recording (voltage clamp recording of excitatory post synaptic currents); stim, stimulation (stimulation of the granule cell axons). (b) Control experiment performed in the absence of caged compounds excluded photoartefacts on synaptic transmission. Upper panel: sample traces (average of 30 sweeps) of mossy fibre (Mf) EPSCs before and after uncaging. Lower panels: summary time course of normalized Mf-EPSCs. (c) Modulation of Mf-EPSCs after uncaging compound 5 (0.2, 1.0 or 10 μM). Upper panels: sample traces (average of 30 sweeps) of Mf-EPSCs before and after uncaging. Lower panels: summary time course of normalized Mf-EPSCs. (d) Modulation of Mf-EPSCs after uncaging compound 6 (0.2; 1.0 or 10 μM). Upper panels: sample traces (average of 30 sweeps) of Mf-EPSCs before and after uncaging. Lower panels: summary time course of normalized Mf-EPSCs. (e) Bar graphs illustrating the different time regimes of the effects illustrated in c,d. Error bars represent s.e.m. P-values were obtained by Wilcoxon matched pairs test. *P<0.05, **P<0.01.

