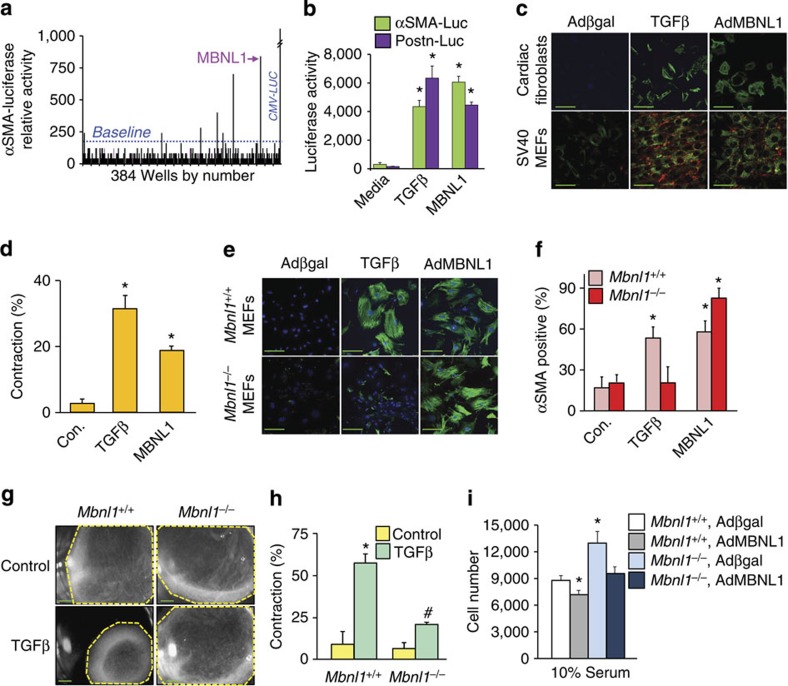
Figure 1. MBNL1 overexpression mediates myofibroblast transformation.
(a) A schematic of myofibroblast differentiation measured by αSMA-luciferase activity from one 384-well plate of the Mammalian Genome Collection cDNA library, which identified MBNL1 as a potent inducer of the reporter. (b) αSMA-luciferase and periostin (Postn)-luciferase promoter activity in cultured cardiac fibroblasts transfected with a MBNL1 expression plasmid or treated with TGFβ. Average light units±s.e.m., N=3, analysis of variance (ANOVA) and Newman–Keuls pairwise analysis, *P<0.05 versus media control. (c) Immunofluorescence for αSMA+ stress fibres (green) in cardiac fibroblasts and SV40-transformed MEFs treated with TGFβ or infected with Adβgal (control) or AdMBNL1. SV40 MEFs were also stained with collagen 1 (red). (d) Quantification of collagen gel matrix contraction in cardiac fibroblasts treated with TGFβ, AdMBNL1 or Adβgal (Con.) 48 h later. Average contraction±s.e.m., N=3, ANOVA and Newman–Keuls pairwise analysis, *P<0.05 versus Con. (e,f) Immunofluorescent images and quantification of αSMA-positive stress fibres (green) in primary Mbnl1+/+ and Mbnl1−/− MEFs with TGFβ treatment or AdMBNL1 infection. Controls were infected with Adβgal. Blue is staining for nuclei (Topro-3 Iodide). Bars represent the average number of fibroblasts with αSMA+ stress fibres relative to the total number of nuclei±s.e.m., N⩾330, ANOVA and Newman–Keuls pairwise analysis, *P<0.05 versus Adβgal (Con.). (g,h) Photographs and quantification of contraction of collagen matrices seeded with Mbnl1+/+ and Mbnl1−/− MEFs with or without 48 h of TGFβ treatment. Average contraction±s.e.m., N=3, ANOVA and Newman–Keuls pairwise analysis, *P<0.05 versus no treatment control. (i) Proliferation rates in Mbnl1+/+ and Mbnl1−/− MEFs measured by colorimetric MTT assay 48 h after AdMBNL1 or Adβgal (control) infection. Average cell number±s.e.m., N=3, ANOVA and Newman–Keuls pairwise analysis, *P<0.05 versus Mbnl1+/+, Adβgal. All scale bars, 50 μm.

