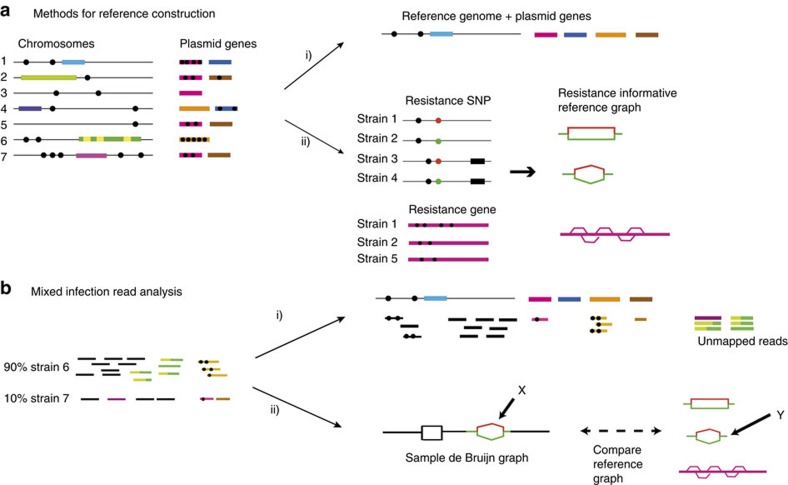
Figure 1. Representation and analysis of bacterial genetic variation.
(a) Reference construction methods. Left: chromosomes with SNPs (black circles) and genes (coloured blocks) from strains of a bacterial species. Option (i) picks strain 1 to be reference, plus one example of each plasmid resistance gene. In option (ii), our method is to build the de Bruijn graph of all strains, restrict to loci of interest, and annotate resistance (red) and susceptible (green) alleles. For SNPs, local graph topology is determined by adjacent SNPs (black dots) and indels (black blocks). (b) Mixed infection read analysis. Left: sequence data from a clinical sample harbouring major (90%) and minor (10%) strains. Right: option (i) maps the reads to the reference genome to detect SNPs and genes. In option (ii), our approach, we construct the de Bruijn graph of the sample and compare with the reference graph. We see a specific SNP is present both in the sample and the reference graph (marked X, Y). Both the resistant (red) and susceptible (green) alleles are present in the sample, and within-sample frequency is estimated from sequencing depth on each allele.

