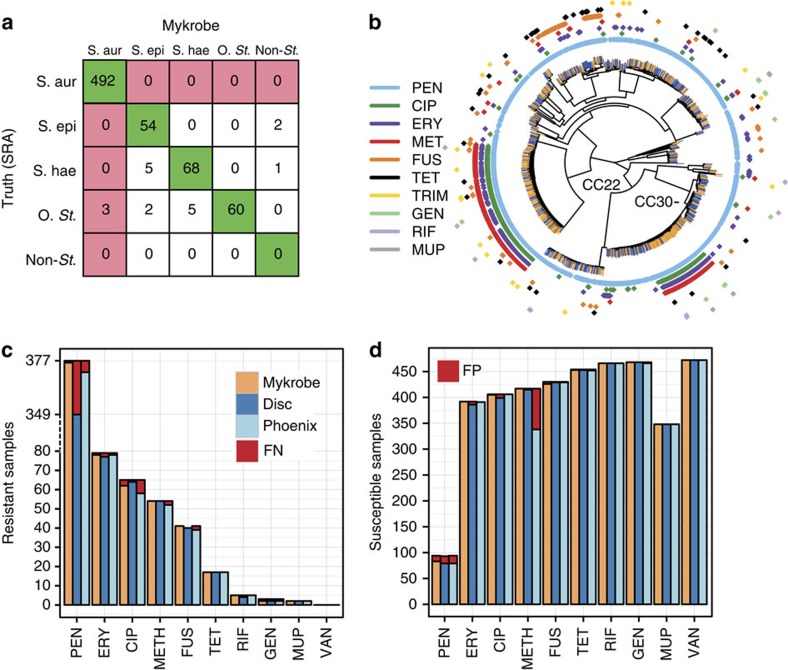
Figure 2. Species and susceptibility predictions for S. aureus.
(a) Species classification results on species validation set St_B (n=692). Red shading of box indicates errors we wish to minimize. S.aur, S. aureus; S.epi, S. epidermidis; S.hae, S. haemolyticus; O.st, other staphylococcus; Non-st, non staphylococcal. ‘Truth (SRA)' is the species as annotated in the SRA metadata, which was used as truth for comparisons. (b) Phylogeny of S. aureus samples used in evaluating resistance prediction, with tips marked orange or blue to represent samples in training set (St_A1, n=495) or validation set (St_B1, n=471). Drug resistance is indicated in concentric rings around the phylogenetic tree; plasmid-mediated resistance (erythromycin in purple, tetracycline in black) is distributed across the whole tree. The two multi-drug resistant clades are in UK hospital clonal complexes CC22 and CC30. (c) Proportion of resistant S. aureus samples (St_B1) correctly identified as resistant by Mykrobe predictor (orange), disc test (dark blue) and Phoenix (light blue) compared with consensus, with false negatives in red. Note the break in the y axis between 80 and over 300 to show penicillin on same plot. (d) As c, but showing proportion of susceptible samples correctly identified as susceptible—false positives in red. A small number of failed disc tests for fusidic acid in panel c result in a lower bar. PEN, penicillin; ERY, erythromycin; CIP, ciprofloxacin; METH, methicillin; FUS, fusidic acid; CLIN, clindamycin; TET, tetracycline; RIF, rifampicin; GEN, gentamicin; MUP, mupirocin; TRIM, trimethoprim; VAN, vancomycin.

