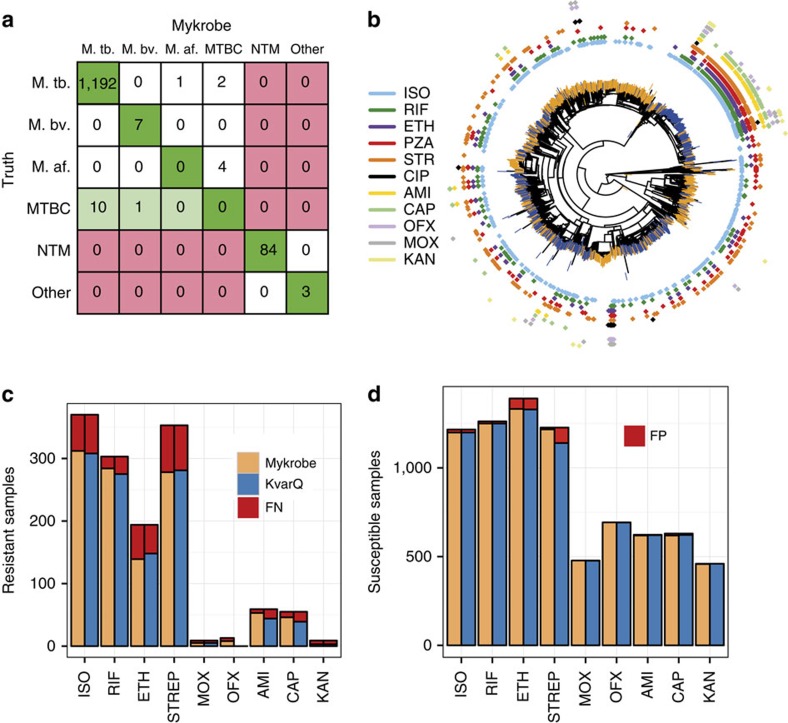
Figure 5. Species predictions for mycobacteria and resistance predictions for MTBC.
(a) Species classification results on a validation set (MTBC_A2+Myco_Retro, n=1,304). Colours indicate misclassifications between NTM/MTBC (red), concordance with ‘truth' (dark green), or greater resolution from Mykrobe predictor than PCR (light green). M.tb., M. tuberculosis; M.af., M. africum; M.bv., M. bovis. See Supplementary Table 1 for details of ‘truth' species. (b) Phylogeny of MTBC samples with phenotype data, with tips marked orange or blue to indicate training set (MTBC_A, n=1,920) or validation set (MTBC_B, n=1,609). Drug resistance is shown in concentric rings around the phylogenetic tree. Resistance exists across the phylogeny, especially against isoniazid (light blue), with a clustering of multi-drug resistance in the Beijing lineage. (c) Proportion of resistant MTBC samples correctly identified as resistant by Mykrobe predictor (yellow) and KvarQ (light blue) compared with DST phenotype—false negatives in red. (d) As c, but showing proportion of susceptible samples called as susceptible—false positives in red. ISO, isoniazid; RIF, rifampicin; ETH, ethambutol; STREP, streptomycin; MOX, moxifloxacin; OFX, ofloxacin; AMI, amikacin; CAP, capreomycin; KAN, kanamycin.

