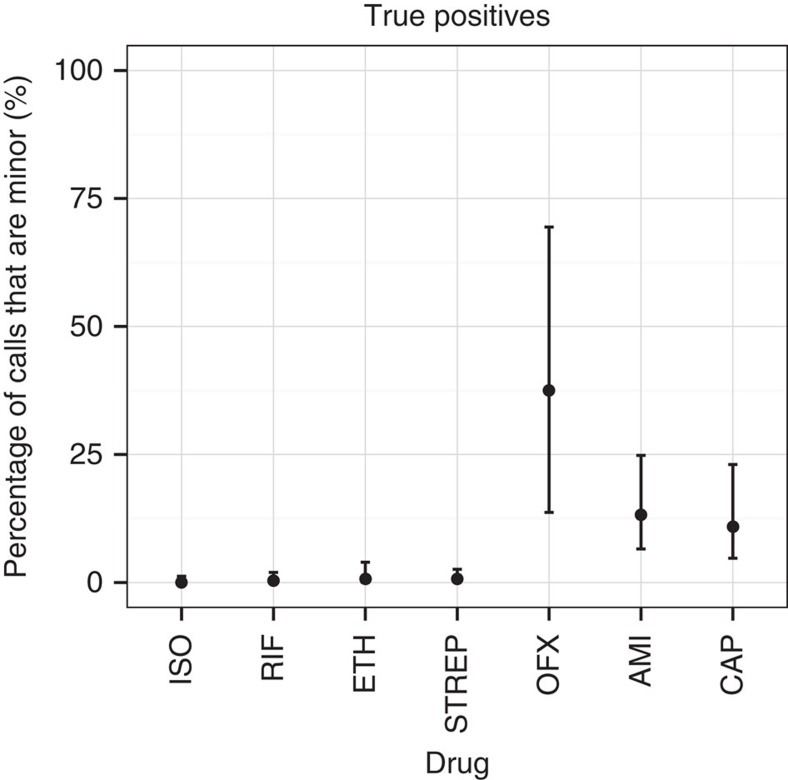
Figure 6. Percentage of true positive resistant calls in M. tuberculosis validation set due to minor alleles.
Confidence intervals are calculated using the Clopper–Pearson interval. Drugs with <10 resistant samples were excluded to avoid overly large confidence intervals. For aminoglycosides and quinolones, minor populations explain between 11–38% of true positive resistance predictions. ISO, isoniazid; RIF, rifampicin; ETH, ethambutol; STREP, streptomycin; OFX, ofloxacin; AMI, amikacin; CAP, capreomycin.

