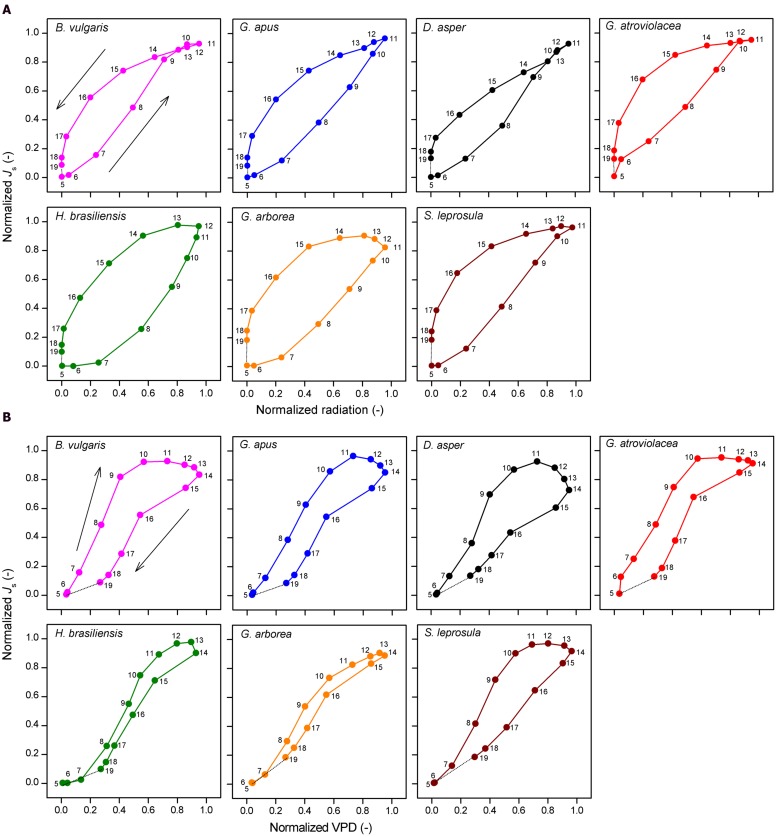
FIGURE 6.
Normalized hourly sap flux density (Js) plotted against (A) normalized hourly radiation and (B) VPD. Data of four bamboo (upper row) and three tree species (lower row). Hourly averages derived from simultaneous measurements on five culms per species and by averaging the values of three sunny days to minimize influences of weather. The numbers in the sub-figures indicate the respective time of the day.

