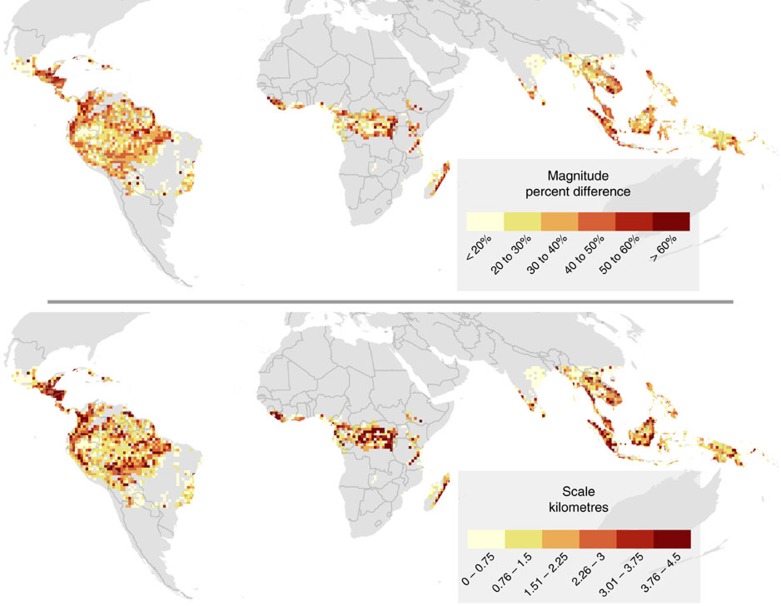
Figure 2. Magnitude and scale of forest carbon edge effects across the tropics.
Edge effect relationships derived for tropical forest within each 10,000 km2 sub-region (N=2,836), with redder colours denoting stronger edge effects both in terms of magnitude of difference (% difference between biomass at forest edge and in forest interior) and scale of the edge effect (the distance from forest edge at which biomass is within 10% of the asymptotic biomass, or that seen in the interior of forests; in km).

