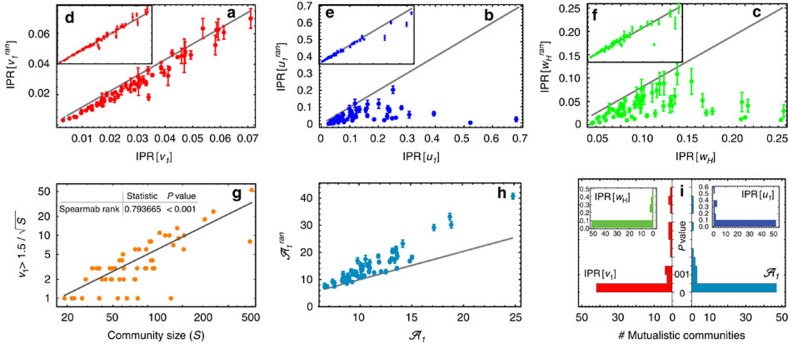
Figure 2. Localization patterns and effect on the asymptotic amplitude.
(a–c) Localization of the leading eigenvectors for null model 1 versus empirical mutualistic networks (where  , with q1=v1, u1 or wH, with right eigenvector v1 in red, left eigenvector u1 in blue and reactive eigenvector wH in green). Points represent average value of 1,000 randomizations, bars indicate the standard deviation. 1:1 line represents the value of the empirical mutualistic networks. (d–f) Same for null model 2. (g) Number of (localized) components as a function of the community size: a significant correlation is observed (Spearman Rank Test=0.715). (h) Effect of the localization on the asymptotic amplitude
  for the simulated perturbation ξall on empirical mutualistic networks with respect to null model 1
  . In ≈85% of the cases, the perturbation amplitude is significantly attenuated (P value≤0.05). (i) P values of the observed values of localization and asymptotic amplitudes in empirical networks with respect to null model 1. Parameters here are δ=0.5 and γ0=1.

