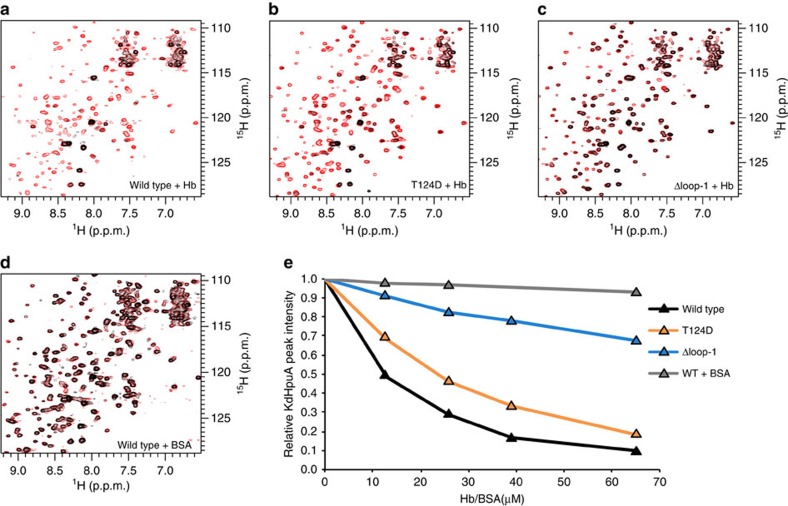
Figure 7. NMR spectroscopy analysis of Hb binding to KdHpuA.
HSQC spectra were collected of 130 μM wild type, T124D and Δloop-1 KdHpuA alone, and with 13, 26, 39 and 65 μM Hb or BSA. (a–d) HSQC spectra of the start (0 μM Hb/BSA—red) and end (65 μM Hb/BSA—black) points of titration of Hb into wild type (a), Hb into T124D (b), Hb into Δloop-1 (c) and BSA into wild type (d). (e) Chart showing the relative intensities of KdHpuA amide peaks as they decrease during titration with Hb but not with BSA.

