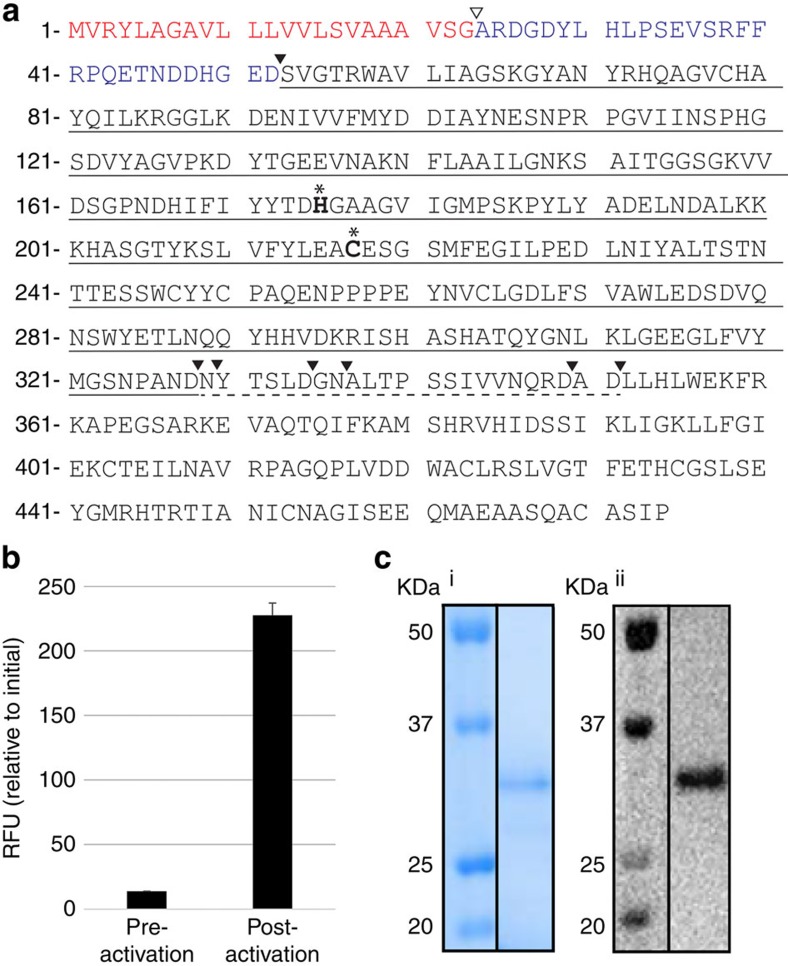
Figure 2. Expression of active rOaAEP1b in E. coli.
(a) Sequence of OaAEP1b predicted from O. affinis genomic DNA. Predicted ER signal sequence shown in red; N-terminal propeptide shown in blue; the putative signal peptidase cleavage site is indicated by ∇ and autocatalytic processing sites by ▾. The mature OaAEP1 cyclase domain is underlined and the C-terminal auto-processing region is indicated with broken underline. The putative catalytic dyad is shown in bold and labelled with *. (b) An rOaAEP1-containing anion exchange fraction pre-and post-activation at pH 4.5 (5 h, 37 °C) was tested for activity against the wt IQF peptide (14 μM). Baseline fluorescence from a no substrate control has been subtracted and the relative fluorescence intensity (RFU) at t=90 min is reported. The average of two technical replicates is shown and error bars report the range (c) Activated rOaAEP1b purified by cation exchange was analysed by SDS–PAGE and (i) Instant blue staining or (ii) Western blotting with anti-OaAEP1b (residues D47–P474) polyclonal rabbit serum.

