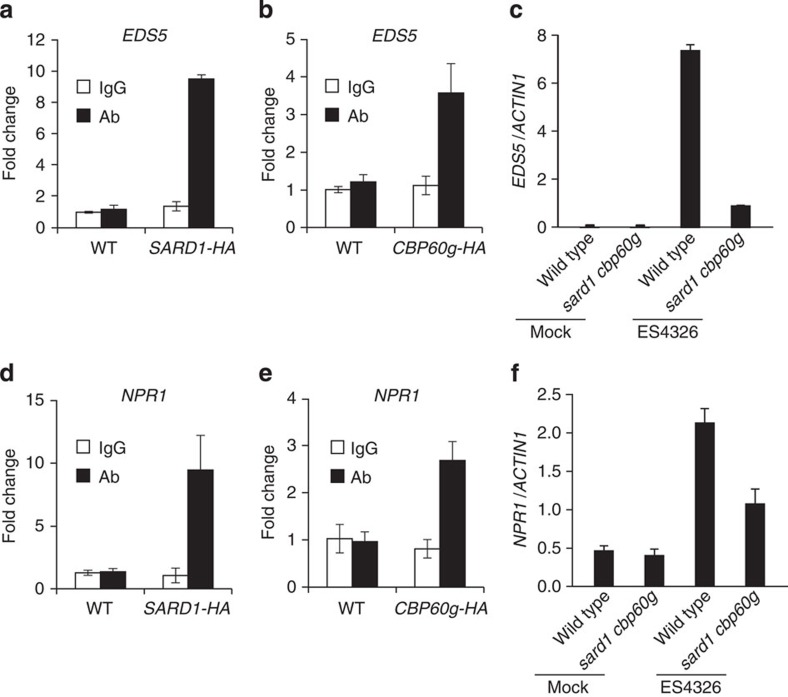
Figure 3. EDS5 and NPR1 are direct binding targets of SARD1 and CBP60g.
(a,b) Recruitment of SARD1-HA (a) and CBP60g-HA (b) to EDS5 promoter after P.s.m. ES4326 infection as determined by ChIP-PCR. ChIP was performed as described in Fig. 2. Real-time PCR was carried out using primers specific to EDS5 promoter. ChIP results are presented as fold changes by dividing signals from ChIP with the anti-HA antibody by those of IgG controls, which are set as one. Bars represent means±s.d. (n=3). (c) Induction of EDS5 expression in wild type and sard1-1 cpb60g-1 by P.s.m. ES4326. Leaves of 25-day-old plants were infiltrated with P.s.m. ES4326 (OD600=0.001) or 10 mM MgCl2 (mock) 12 h before collection for RT–PCR analysis. Bars represent means±s.d. (n=3). (d,e) Recruitment of SARD1-HA (d) and CBP60g-HA (e) to the promoter of NPR1 after treatment with P.s.m. ES4326. ChIP and data analysis were carried out similarly as in a and b. Bars represent means±s.d. (n=3). (f) Induction of NPR1 expression by P.s.m. ES4326 in wild-type and sard1-1 cpb60g-1 double mutant plants. Samples were collected 12 h after infiltration with P.s.m. ES4326 (OD600=0.001) or 10 mM MgCl2 (mock). Bars represent means±s.d. (n=3).

