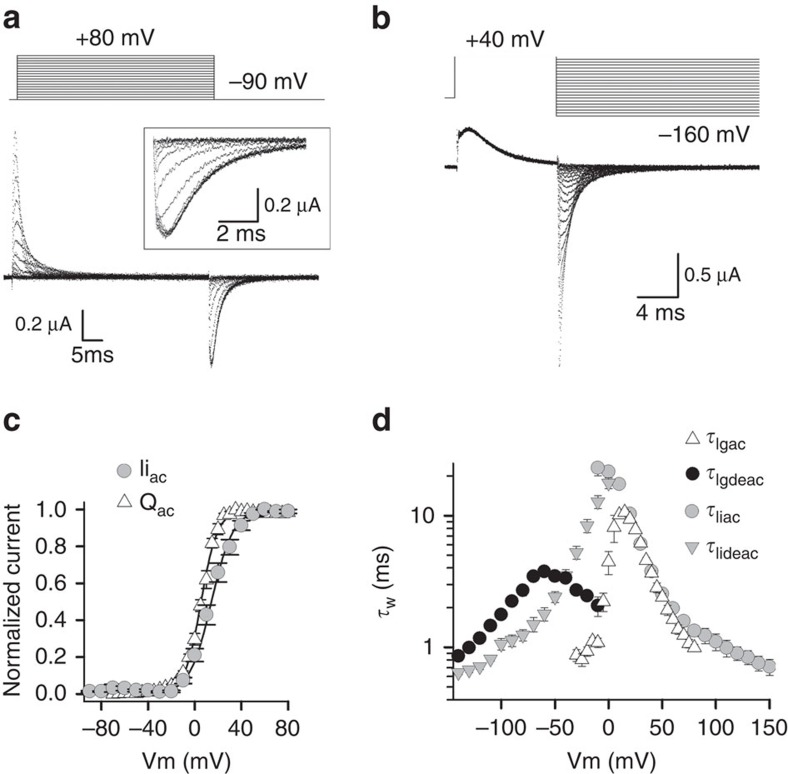
Figure 1. Kv3.1b gating current recordings monitor the VSD movement.
(a) Gating currents (Ig) of WT Kv3.1b after depletion of K+ and subsequent application of external TEA to block the remaining ionic current. Ig recordings were obtained using the activation pulse protocol shown on top. The holding potential was −120 mV and cells were depolarized in 5-mV increments from −120 mV to +80 mV. Background leak and capacitive currents were subtracted using a –P/4 protocol. Inset shows a scaled-up view of the Igoff currents obtained by stepping to −90 mV. (b) Pulse protocol to analyse the deactivating Igdeac currents. (c) Voltage dependence of activating charge movement (QV curve, open triangles), which was obtained by integrating the Igoff currents from pulse protocols shown in a (data are shown as average±s.e.m., n=6). For comparison, the ionic GV curve from Supplementary Fig. 1 is displayed (grey circles). (d) Voltage dependence of the average time constants±s.e.m. of Igac (τIgac, open triangles, n=6) and Igdeac (τIgdeac, black circles, n=6). τIgac kinetics were obtained from fitting the Igac current decays (from pulse protocols shown in a) with a single exponential function. τIgdeac kinetics were obtained by approximating the Igdeac current decays (from pulse protocols shown in b) with a double exponential function and represented values are the weighted time constants. As comparison the ionic τIiac and τIideac kinetics (Supplementary Fig. 1) are displayed in grey circles and triangles, respectively.

