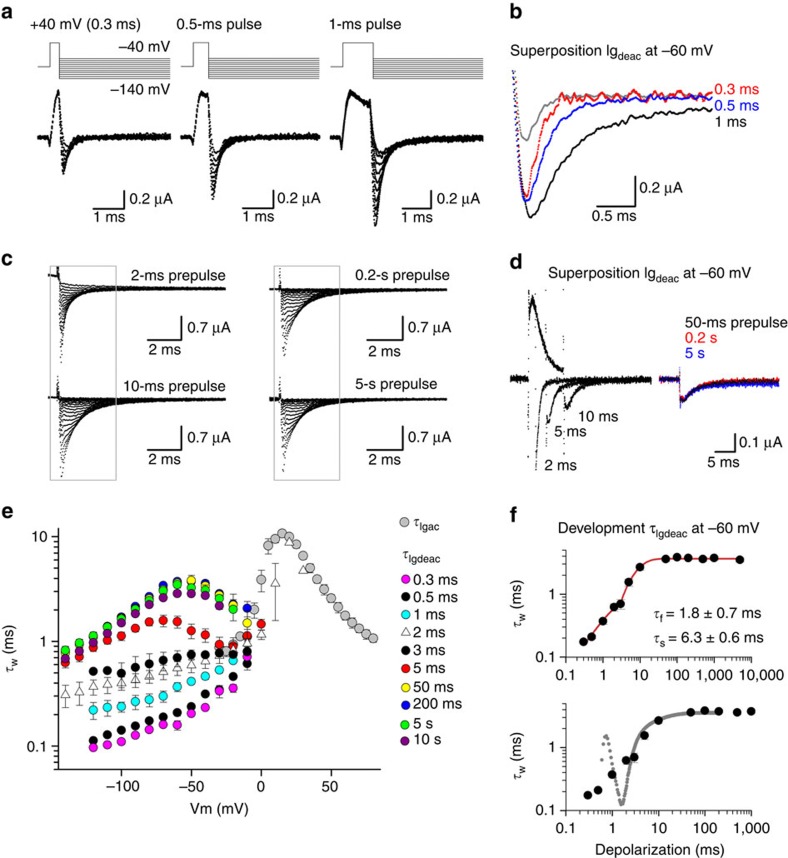
Figure 2. Igdeac kinetics of Kv3.1b as a function of activating pulse duration.
(a) Igdeac currents upon very short depolarizations to +40 mV elicited using the pulse protocol shown on top. (b) Superposition of Igdeac recordings from a at −60-mV repolarization following a 0.3-ms (grey, with a scaled version shown in red), a 0.5-ms (blue) and a 1-ms (black) long activating pulse to +40 mV. Note the gradual deceleration in Igdeac with increasing pulse duration. (c) Igdeac currents on different pulse durations at +40 mV (2 ms to 5 s in duration). The protocols were applied in a random order to exclude non-specific or depletion artifacts that might affect the kinetics over time, such as depletion of PIP2 levels57. (d) Left, superposition of Igdeac at −60 mV following 2-, 5- and 10-ms-long activating pulses. Right, superposition of Igdeac at −60 mV following 50-ms (black), 0.2-s (red) and 5-s (blue) long activating pulses. Prolonging the pulse from 2 to 10 ms slowed down Igdeac decay further whereas longer pulses had no additional effect. (e) Voltage dependence of the weighted τIgdeac time constants as a function of activating pulse duration. Data is shown as mean±s.e.m. (n=5). Note the gradual slowing in τIgdeac when depolarization times became longer. (f) Top panel shows the mean±s.e.m. of the weighted τIgdeac time constant at −60 mV as a function of depolarization time (n=5). This plot shows that there are two slowing processes, and fitting this relation with a double exponential function indicated that the deceleration in τIgdeac developed with a fast time constant (τf) of 1.8±0.7 ms and a slower component (τs) of 6.3±0.6 ms (n=5). The bottom panel displays a superposition of the same Igdeac kinetics and a scaled ionic current activation (the first spike in ionic current trace is the remaining capacitive transient). Note that the second slowing process (τs) matched the time course of channel opening.

