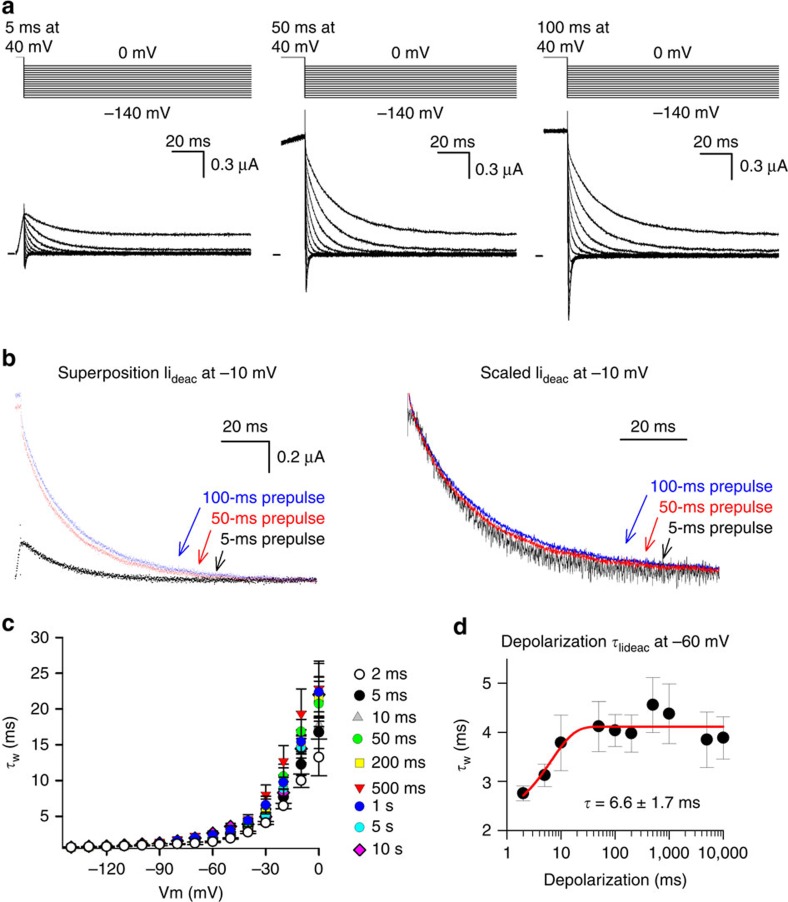
Figure 3. Iideac kinetics of Kv3.1b as a function of activating pulse duration.
(a) Ionic current deactivation (Iideac) of Kv3.1b elicited using the pulse protocols shown on top. From left to right the activating pulse at +40 mV was increased from 5 to 50 ms, and to 100 ms. (b) Left panel shows a superposition of Iideac at −10 mV following a 5-ms (black), a 50-ms (red) and a 100-ms (blue) long activating pulse. Right panel displays a superposition of the same Iideac currents after rescaling them. Note the slowing in Iideac decay time (τIideac) when the duration of the activating pulse was increased. (c) Voltage dependence of the weighted τIideac as a function of activating pulse duration at +40 mV, shown as mean±s.e.m. (n=5). When the duration time was increased from 2 ms (white) up to 50 ms (green) there was a gradual deceleration in τIideac. Note that depolarizations longer than 50 ms in duration did not cause any further significant changes in τIideac. (d) Weighted τIideac at −60 mV as a function of depolarization time. This plot shows, in contrast to Igdeac kinetics, that the Iideac kinetics displayed only a single slowing process, which developed with a time constant of 6.6±1.7 ms (n=5, data represented as mean±s.e.m.).

