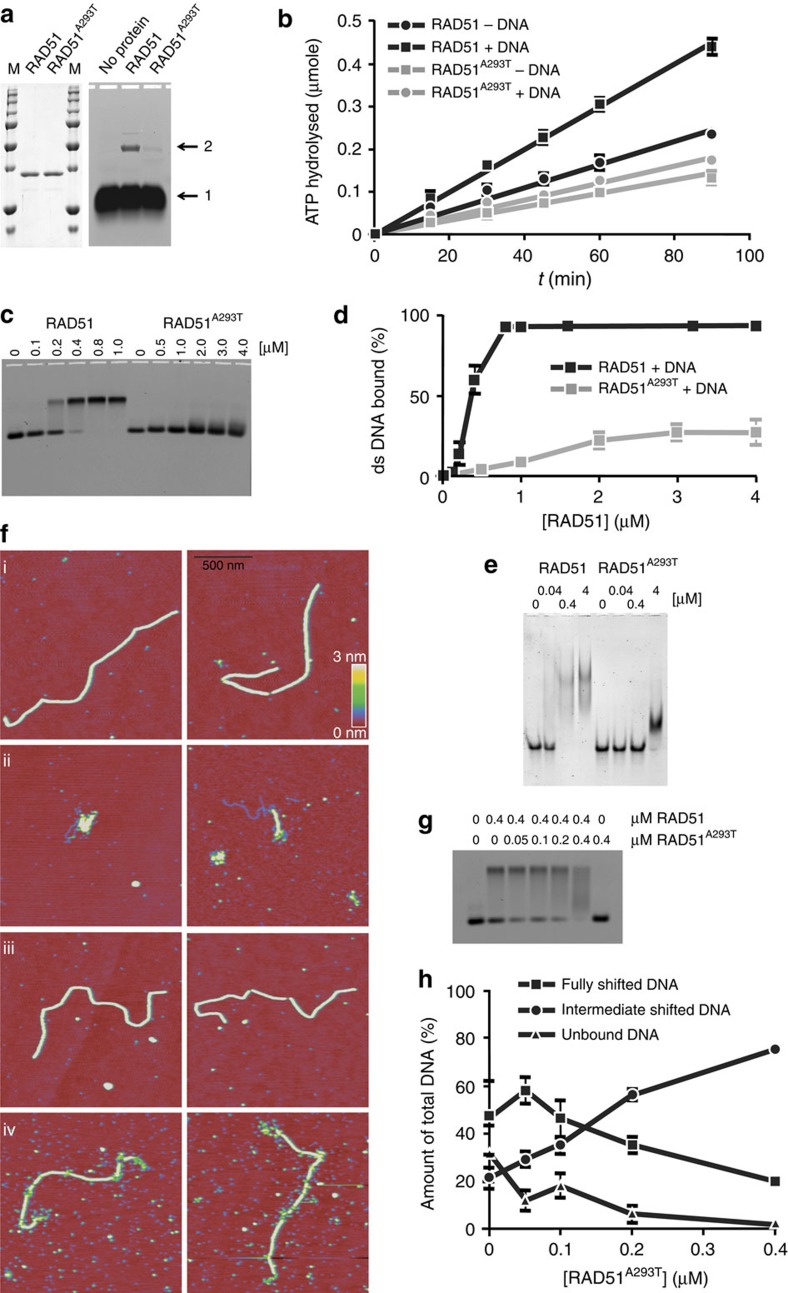
Figure 4. Biochemical studies of RAD51.
(a, left panel) RAD51 purification. Wild-type RAD51 and RAD51A293T were purified and 1 μg of protein was electrophoresed through an SDS-containing polyacrylamide gel; M, molecular weight marker. (a, right panel) D-loop assay. The efficiency of D-loop formation, reporting on joint molecule formation and DNA strand-exchange activity, was tested; arrow 1 indicates the free oligonucleotide, arrow 2 indicates the strand-exchange product between the oligonucleotide and a homologous supercoiled plasmid. (b) ATPase assay. The ATPase activity of wild type and RAD51A293T, either in the absence or presence of single-stranded DNA, was measured using thin-layer chromatography. The amount of ATP hydrolysed is plotted as a function of time. Error bars represent the s.e.m. from three experiments. (c) EMSA dsDNA. Fluorescently labelled double-stranded DNA molecules (66 bp) were incubated with the indicated concentrations of wild-type RAD51 or RAD51A293T in the presence of ATP and Ca2+ and electrophoresed through a native agarose gel. (d) Quantification of the percent DNA bound as a function of protein concentration. Error bars indicate the s.e.m. of five to seven experiments. (e) EMSA ssDNA. Fluorescently labelled single-stranded DNA molecules (66 nt) were incubated with the indicated concentrations of wild-type RAD51 or RAD51A293T in the presence of ATP and Ca2+ and electrophoresed through a native polyacrylamide gel. (f) Scanning force microscopy (SFM). SFM images of filaments formed by wild-type human RAD51 on double-stranded DNA in the presence of 100 mM KCl (i) and mutant RAD51A293T (ii). Examples of nucleoprotein filaments formation on double-stranded DNA in the presence of 30 mM KCl by wild-type (iii) and mutant (iv) RAD51. All images are 1.5 × 1.5 μm and height is represented by colour in the range of 0–3 nm, red to yellow as shown in the scale bar. (g) EMSA. Double-strand DNA binding was assessed by EMSA in reaction mixtures containing the indicated concentrations of wild-type and mutant RAD51. (h) Quantification of the percent of unbound DNA and protein–DNA complexes detected by EMSA as a function of the RAD51A293T protein concentration.

