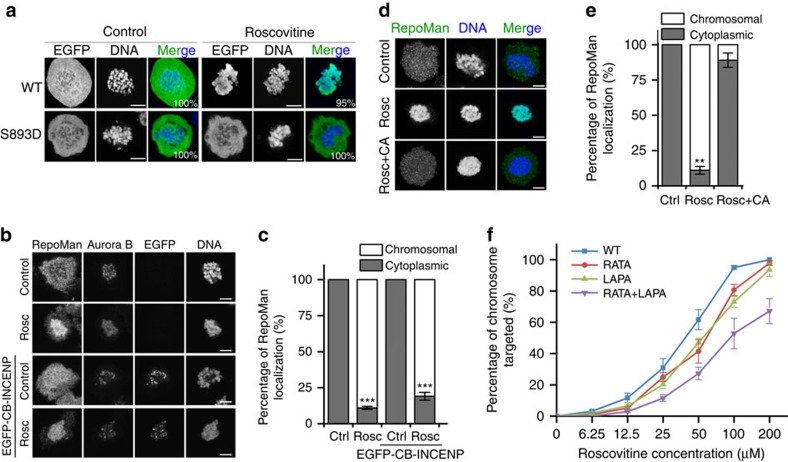
Figure 1. Cdk1 opposes the chromosome targeting of RepoMan.
(a) Nocodazole-arrested U2OS cells transiently expressing EGFP-tagged RepoMan-WT or RepoMan-S893D were treated with dimethyl sulfoxide (DMSO) (control) or Roscovitine (100 μM) for 30 min before fixation and visualization of EGFP and DNA. The numbers in the figures refer to the percentage of cells where the shown phenotype occurred. Scale bars, 5 μm. (b) Confocal images of Nocodazole-arrested U2OS cells, in the absence or presence of Roscovitine (Rosc) and transiently expressed EGFP-tagged CENP-B (CB) fused to INCENP. The fixed cells were stained for endogenous RepoMan, Aurora B and DNA. Scale bars, 5 μm. (c) Quantification of RepoMan localization in b. The graphs show mean percentages±s.e.m. from three independent experiments (≥73 cells for each condition per experiment). ***P<0.001 in paired t-test, compared with control (Ctrl). (d) Nocodazole-arrested U2OS cells were treated with DMSO (control) or 100 μM Roscovitine for 30 min, as such or in combination with 20 nM Calyculin A (CA). The fixed cells were stained for endogenous RepoMan and DNA. Scale bars, 5 μm. (e) Quantification of EGFP-RepoMan localization in d. Graphs show mean percentages±s.e.m. from three independent experiments (≥74 cells for each condition per experiment). **P<0.01 in paired t-test, compared with control (Ctrl). (f) Nocodazole-arrested U2OS cells expressing the indicated EGFP-tagged RepoMan variants were incubated for 30 min with different concentrations of Roscovitine before fixation. DNA was stained with DAPI. The figure shows the percentage of cells where the EGFP-fusion was chromosome-associated. The results are expressed as means±s.e.m. from three independent experiments (≥103 cells per data point).

