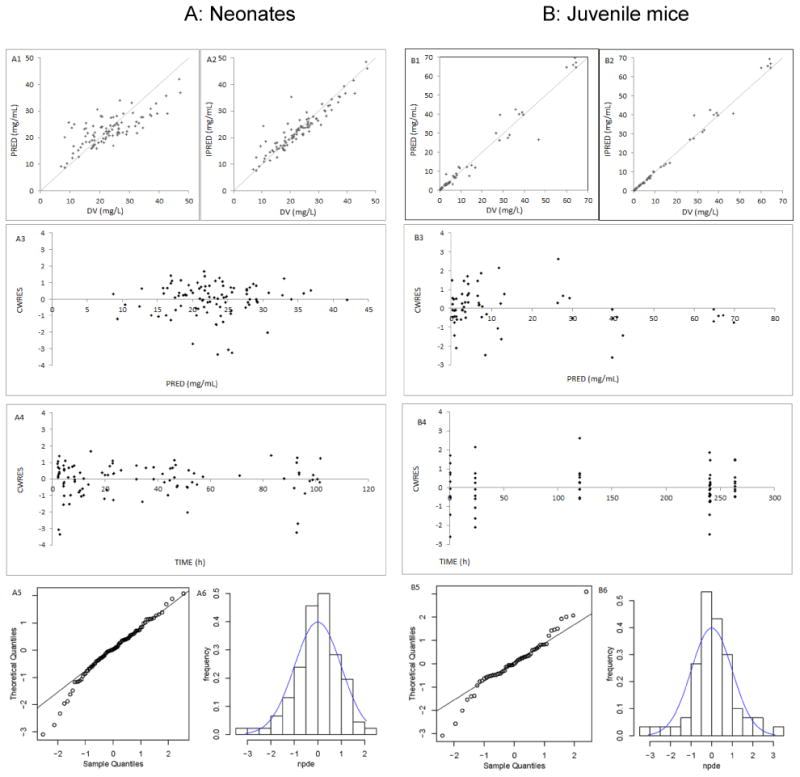
Figure 2. Model evaluation in neonates and juvenile mice.

A: Neonates B: Juvenile mice (1, 2) Routine diagnostic goodness-of-fit plots: population predicted (PRED) versus observed concentrations (DV). Individual predicted (IPRED) versus observed concentrations (DV). (3, 4) Conditional weighted residuals (CWRES) versus time. Conditional weighted residuals (CWRES) versus population predicted concentrations (PRED). (5, 6) Normalized Prediction Distribution Errors (NPDE): QQ-plot of the distribution of the NPDE versus the theoretical N (0,1) distribution. Histogram of the distribution of the NPDE, with the density of the standard Gaussian distribution overlaid
