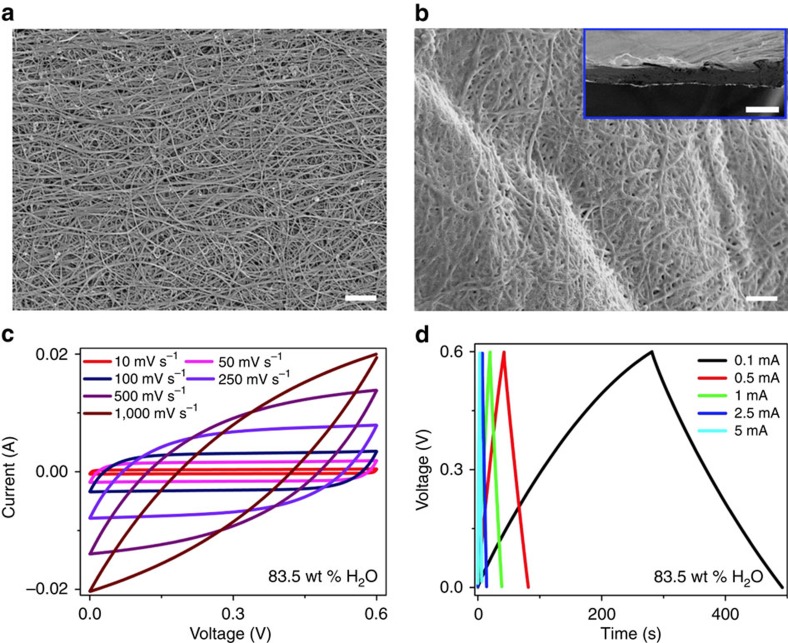
Figure 5. Electrochemical performance of the VSNPs-PAA polyelectrolyte.
(a) An SEM image of the CNT paper. Scale bar, 1 μm. (b) An SEM image of the PPy electrodeposited on CNT paper. Scale bar, 1 μm. (Inset is a cross-sectional SEM image of the PPy electrodeposited on CNT paper. Scale bar, 50 μm.) (c) CV curves at various scan rates from 10 to 1,000 mV s−1. (d) GCD curves at various charging/discharging currents from 0.1 to 5 mA.

