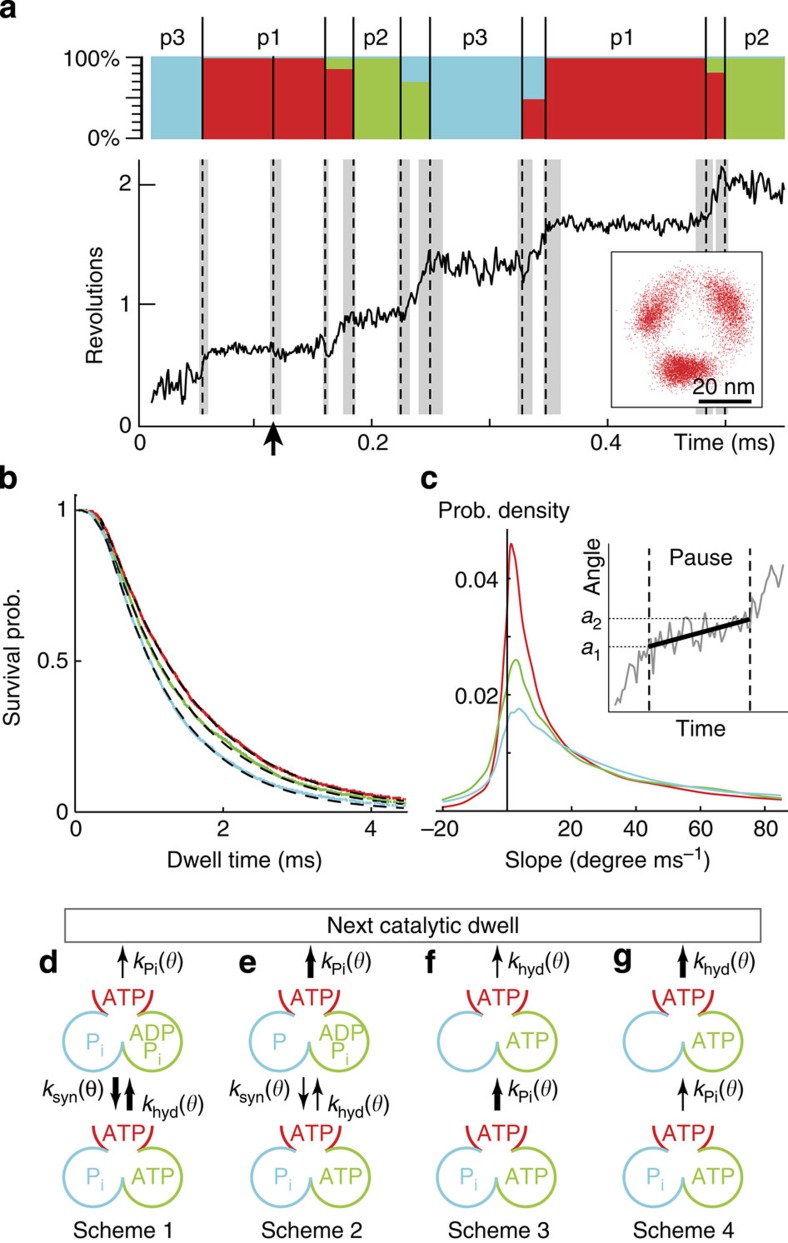
Figure 2. Catalytic dwell statistics from CP and clustering analyses.
(a) The rotary trace (solid line) and the detected CPs (dash lines). Grey regions: uncertainties in CP locations. Inset: a typical rotary trace on the camera x–y plane. The arrow indicates an extra CP due to undesired fluctuations that will be removed by the subsequent clustering. The stacked bar chart shows results from soft clustering. Ordinate: conditional probabilities of a given CP interval assigned to the first (red), second (green) and third (cyan) catalytic dwells. CP intervals that can be assigned to any catalytic dwell with probability ≥95% are denoted as pauses (pause 1 (p1), pause 2 (p2) or pause 3 (p3)). CPs between two pause intervals of the same catalytic dwells are then removed. (b) Dwell-time survival probabilities (dash lines) of the three catalytic dwells from a single F1 (for 40 nm bead case). Colour lines: double exponential fits with time constants τ1∼0.2 ms and τ2∼1 ms. The colour scheme is the same as in a. (c) Slope distribution of the three catalytic dwells for the single F1 as b. The slope is obtained by fitting the pause interval with linear trend (inset). a1 and a2: initial and final angle of the fitted line. (d–g) Four possible scenarios for the catalytic dwells with angle-dependent rate constants. Nucleotide states of the dwell at 80° in Fig. 1 are shown for illustration. Thicker (thinner) arrows represent larger (smaller) rate constants.

