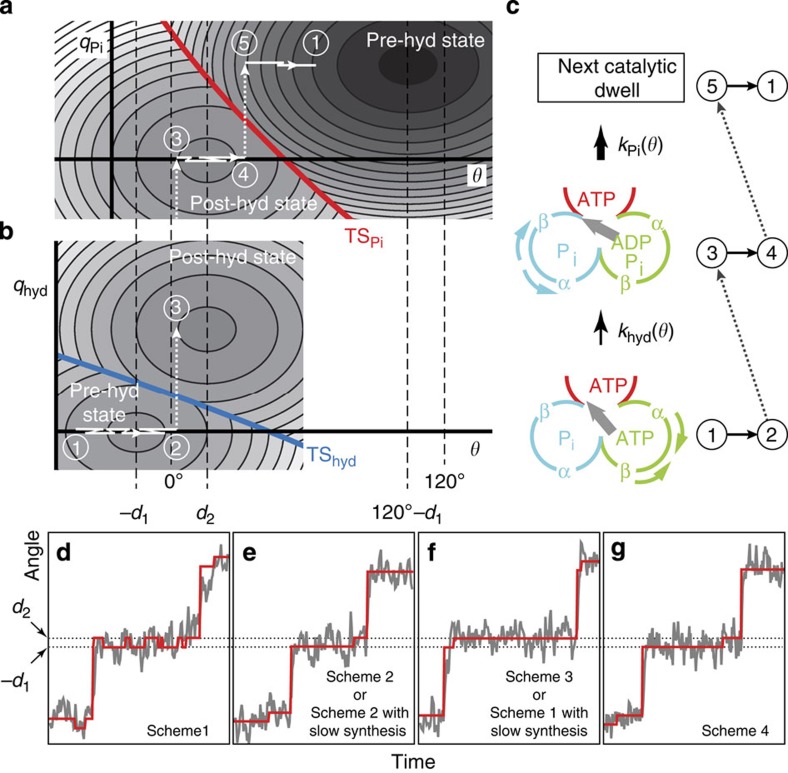
Figure 3. Free-energy surfaces for the catalytic dwell and typical simulation traces.
(a–b) 2D Pi-release (a) and hydrolysis (b) reaction diagrams for the scheme in Fig. 2e with slow synthesis (not to scale). qhyd and qPi are reactive coordinates. The post-hydrolysis state on the product side for the hydrolysis is redrawn on the reactant side for the Pi-release. Free-energy surfaces are represented by equi-energy contours with darker colours for lower energies. The reactant and product surfaces intersect at TShyd and TSPi. The catalytic dwells locate around θ=0° and 120°, and the equilibrium angles of the pre- and post-hydrolysis states locate at θ=−d1 and d2, respectively. A schematic representation of reaction–diffusion path during one catalytic dwell is shown with numberings by white solid (diffusion) and dash (reaction) lines (1→2 and 3→4: diffusion along θ; 2→3 and 4→5: hydrolysis and Pi-release reaction; 5→1: power stroke). For visual clarity, small offsets are introduced in the white solid lines for the diffusion along θ. (c) Correspondence between the chemical states and the numbered trajectory in a,b. The relative orderings of the α- and β-subunits and the associated conformational changes at the catalytic dwell (see Discussion for details) are also indicated. (d–g) Typical simulated traces (for 40 nm bead case) of different schemes (with synthesis rates comparable to or much lower than the hydrolysis rates) in Fig. 2d–g. Subtitles indicate the corresponding scheme(s) for the traces. Grey lines: simulated rotary trace. Red lines: equilibrium angle of the states where the system resides.

